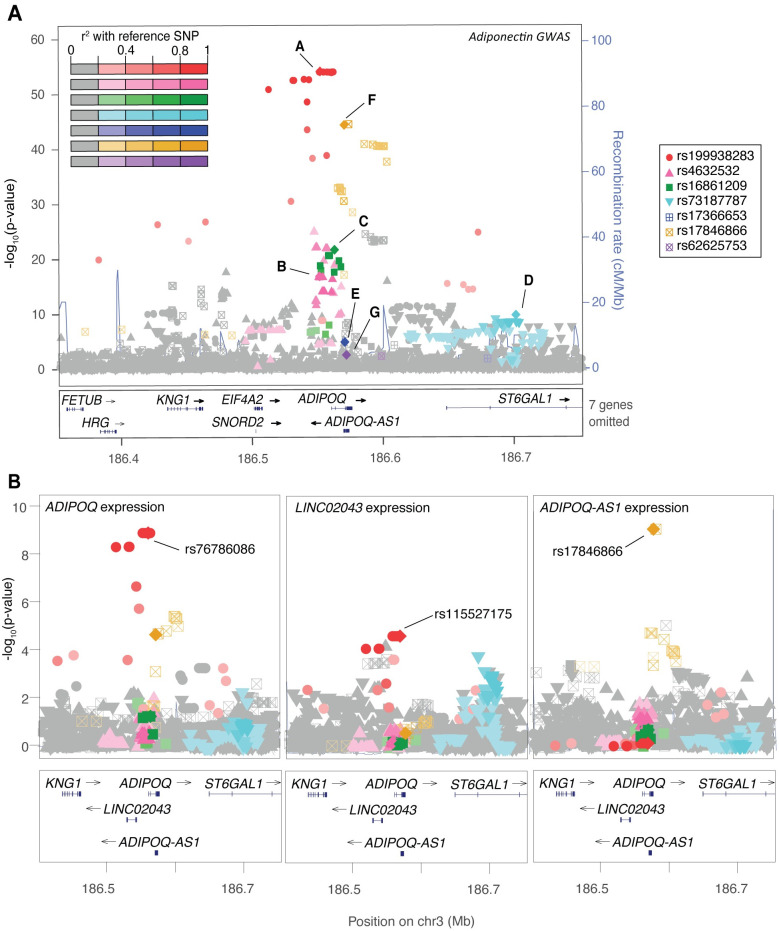
Fig 1. Locus with seven adiponectin GWAS signals and subcutaneous adipose eQTL signals for three transcripts.
(A) Seven signals near ADIPOQ (labeled ‘A’-‘G’) were identified through stepwise conditional analyses for association with adiponectin levels (n = 9,262). The signals are labeled in the order in which they were identified in the stepwise process and are distinguished by both color and shape. Variants are shaded based on LD with the lead variants, shown as diamonds. (B) Two variants in perfect LD (r2 = 1.00) with adiponectin GWAS signal ‘A’ (rs76786086 and rs115527175) show the strongest association with expression levels of ADIPOQ and LINC02043 in subcutaneous adipose tissue in 434 METSIM participants. The strongest adiponectin-associated variant from signal ‘F’ (rs17846866) also shows the strongest association with expression levels of ADIPOQ-AS1 in subcutaneous adipose tissue in 434 METSIM participants.

