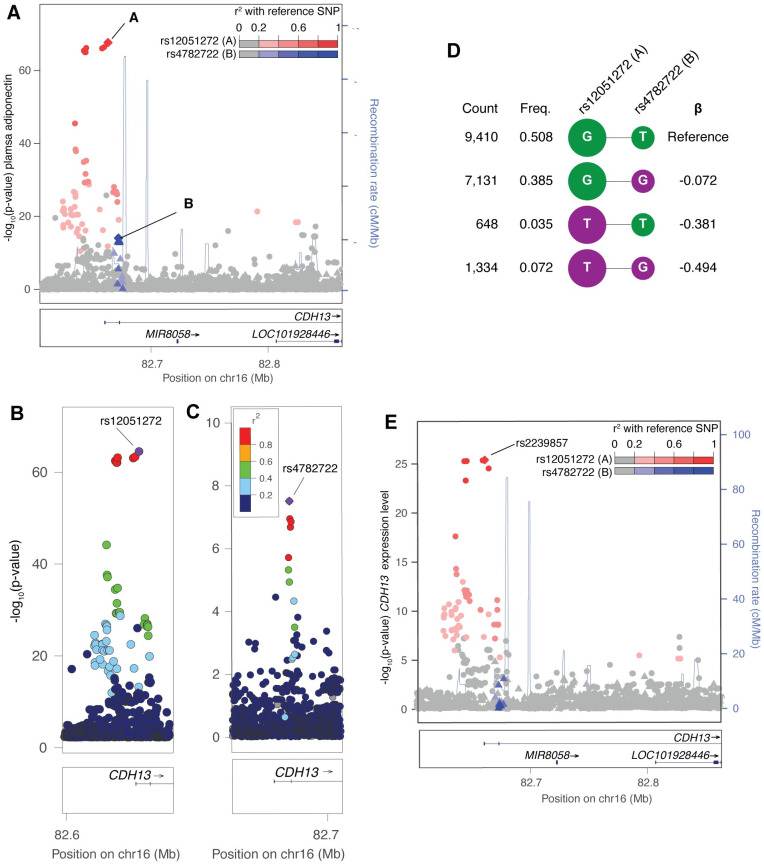
Fig 3. Locus with two adiponectin GWAS signals and one subcutaneous adipose eQTL signal for CDH13.
(A) The first signal with lead variant rs12051272 (red circles, denoted as ‘A’) shows the strongest association in the adiponectin GWAS (n = 9,262). After conditioning on rs12051272, a second signal with lead variant rs4782722 (blue triangles, denoted as ‘B’) remained significant (P<5x10⁻⁸). Variants are shaded based on LD with the lead variants, shown as diamonds. (B) rs12051272 (purple diamond; signal ‘A’) shows the strongest association with adiponectin. (C) rs4782722 (purple diamond; signal ‘B’) shows the strongest association with adiponectin after conditioning on rs12051272 (signal ‘A’). (D) Haplotypes of rs12051272 and rs4782722 estimated from 9,262 METSIM participants. Alleles associated with higher adiponectin levels in single variant analyses are shown in green, alleles associated with lower adiponectin are shown in purple. Haplotype association was performed with adiponectin inverse normalized residuals after adjusting for age, age2, and BMI using the most frequent haplotype as the reference. (E) Variant rs2239857, in perfect LD (r2 = 1.00) with rs12051272, shows the strongest association with expression level of CDH13 in subcutaneous adipose tissue in 434 METSIM participants.

