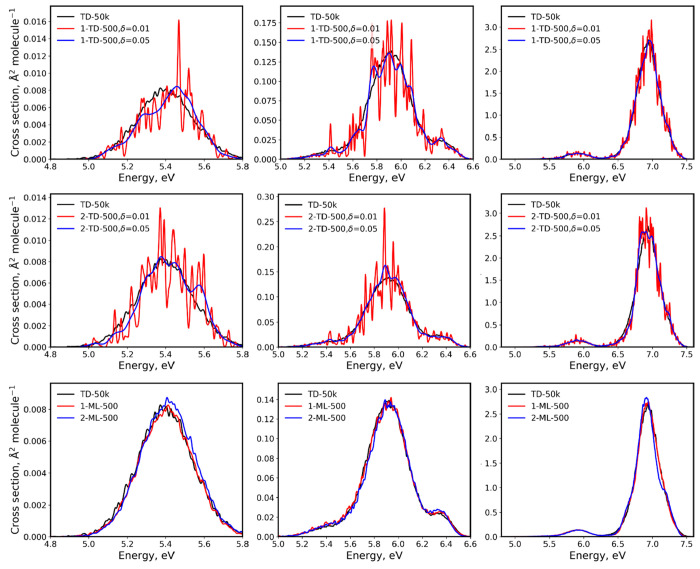
Figure 3.
Comparison of benzene absorption cross sections obtained with TDDFT and ML vs the TD-50k cross section. Two TDDFT cross sections (top frame, 1-TD-500; middle frame, 2-TD-500) were obtained with two 500-points ensembles and plotted for two values of phenomenological broadening δ = 0.01 and 0.05 eV. Two ML cross sections (1-ML-500 and 2-ML-500, bottom frame) were obtained with ML trained on 500 points and with 50k points in the ensemble. ML and TD-50k cross sections were plotted with δ = 0.01 eV. Left plots are plotted only for the first excitation, middle plots for the first three excitations, and the right plots for the entire spectrum considering 10 excitations. Note the different scales.

