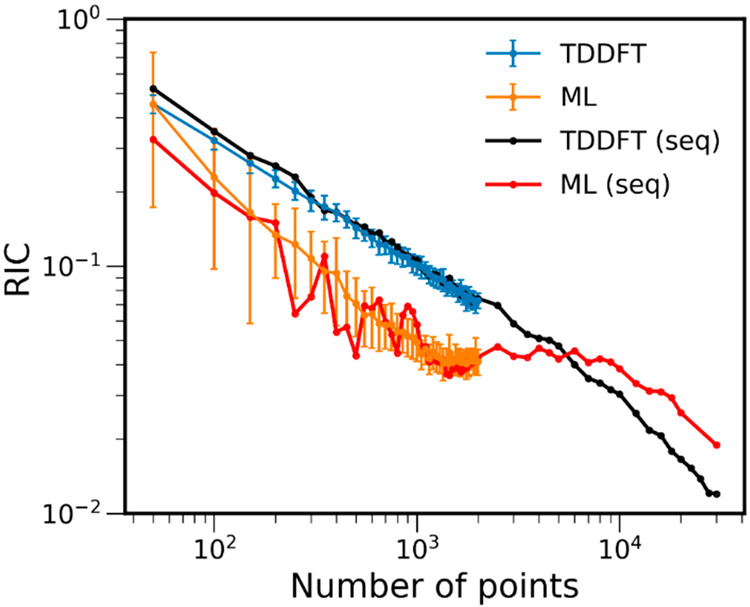
Figure 4.

Relative integral change (RIC) of ML and TDDFT absorption cross sections of benzene calculated with an increasing number of points. The latter represents the size of the training set for a 50k-ensemble ML and the size of the ensemble for TDDFT. All RICs are calculated, taking the pure TDDFT cross section with 50k-ensemble (TD-50k) as the reference. Blue and orange curves are shown for mean RIC values obtained with dozens of calculations for each number of points (more than 100 for small training sets and ca. 30 and more for larger training sets), while black and red curves are shown for a single sequence of number of points (marked seq in the legend). The error bars are one standard deviation to the mean value. The plot is shown with log scaling. The RIC values and part of this plot in linear scaling are available at 10.6084/m9.figshare.c.5081300.
