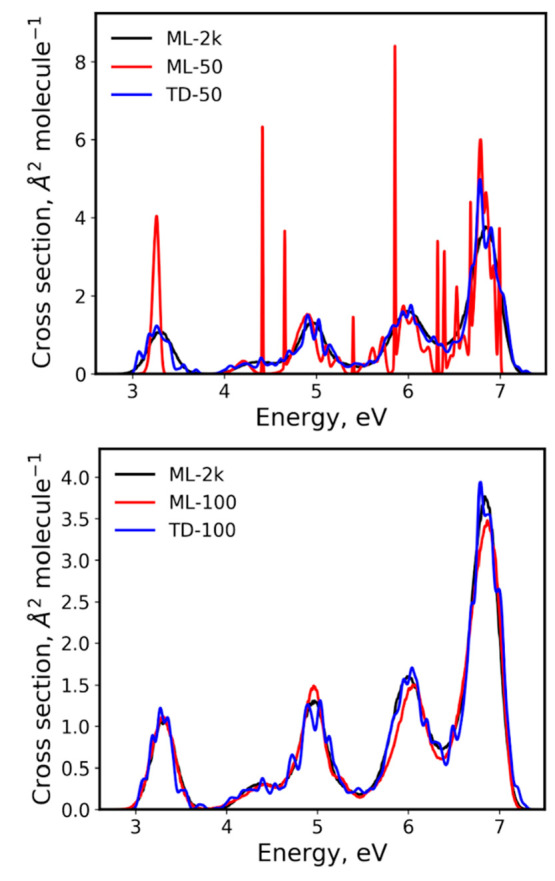
Figure 9.

ML and TDDFT absorption cross sections of compound 2 calculated with 50 and 100 points compared to the ML-2k cross section as the reference. TDDFT cross sections were plotted with δ = 0.05 eV, while all other plots were generated with δ = 0.01 eV.
