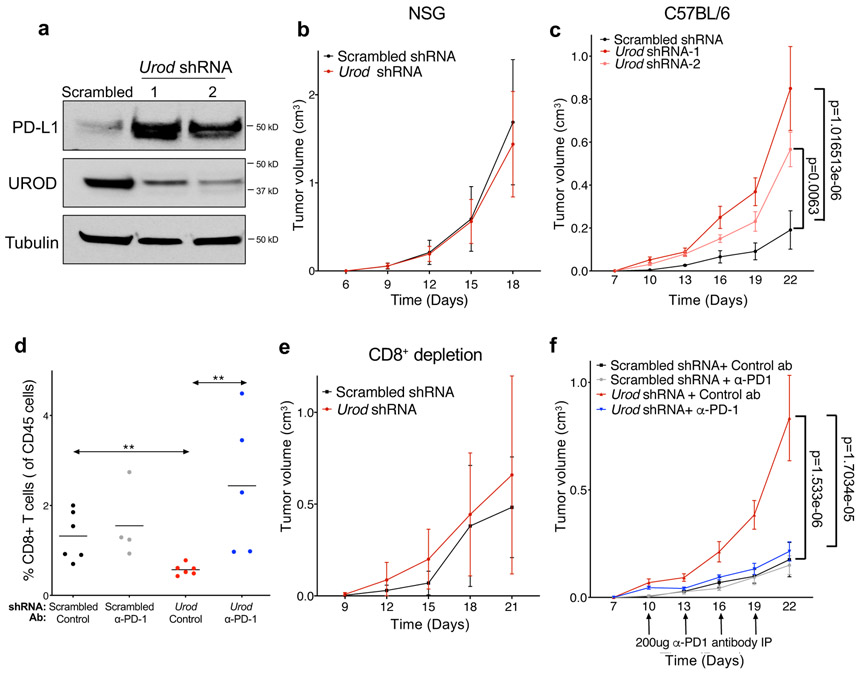
Fig. 3. Loss of UROD accelerates tumorigenesis in vivo by suppressing CD8+ T-cells.
a, Western blot analysis in Lewis Lung Carcinoma (LLC) cells expressing doxycycline-inducible control shRNA or two independent shRNAs targeting Urod. Data from a single experiment are shown and are representative of two independent experiments with similar results. b,c, Quantification of tumor volumes of LLC cells expressing the indicated shRNAs in immunodeficient NSG mice (n=12 mice per group, p value = 0.3542) (b) or in syngeneic C57BL/6 mice (c) (n=7 mice Scrambled shRNA, n=12 mice Urod shRNA-1 and n=11 mice Urod shRNA-2). p value (Scrambled vs Urod shRNA-1) = 1.016513e-06, p value (Scrambled vs. Urod shRNA-2) = 0.0063. d, Quantification of CD8+ tumor infiltrating lymphocytes (TILs, expressed as a percentage of CD45+ cells). A Two-Sample Fisher-Pitman Permutation Test was used to compare CD8+ TILs between groups. n= 6 Scrambled shRNA and Urod shRNA tumors each, n=4 Scrambled + αPD-1 tumors and n= 5 Urod shRNA+ αPD-1 tumors. p value (Scrambled shRNA vs Urod shRNA) = 0.0038, p value (Urod shRNA vs Urod shRNA+ αPD-1) = 0.0029. e,f, Quantification of tumor volumes in syngeneic C57BL6 mice after treatment with a CD8+ depleting antibody (200ug, IP every 3 days) (n= 8 Scrambled mice, n= 6 Urod shRNA mice, p-value = 0.1491) (e) or αPD-1 antibody (200ug, IP every 3 days) (n = 8 Scrambled mice, n= 7 Scrambled + αPD-1 mice, n= 12 Urod shRNA mice, n=12 Urod shRNA+ + αPD-1 mice). p value (Scrambled shRNA vs Urod shRNA) =1.533e-06, p value (Urod shRNA vs Urod shRNA + αPD-1) = 1.7034e-05. (f). For all tumor growth experiments (b-c and e-f), graphs represent mean tumor volumes and error bars represent SDs from the means. A linear mixed effect model was used to determine statistical significance for all tumor growth assays, as described in Statistics and Reproducibility.

