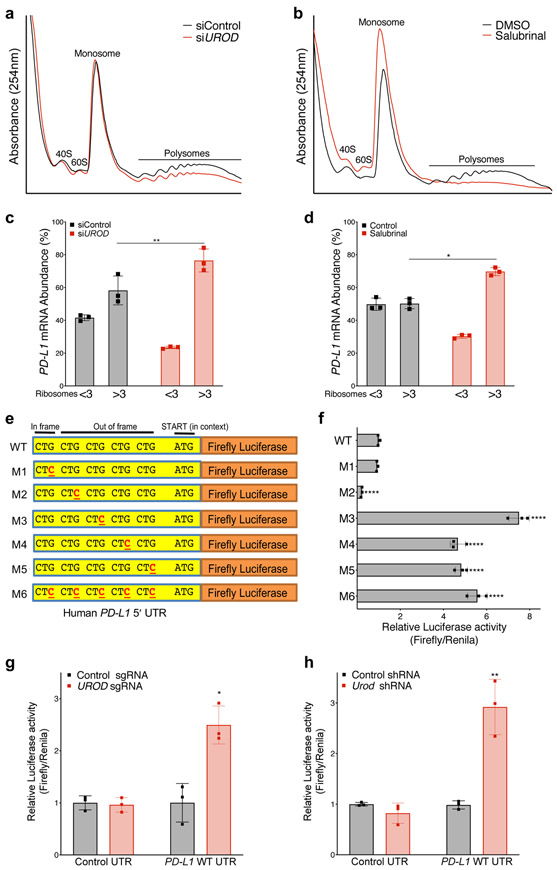
Figure 5. ISR activation enhances PD-L1 translation.
a,b, Polysome analysis of siRNA-treated (a) or Salubrinal-treated (100 μM, 24 hours) (b) H1944 cells. c, qRT-PCR analysis of PD-L1 mRNA in ribosomal fractions from (a). Experiment was performed with two independent primer pairs with similar results. d, qRT-PCR analysis of PD-L1 mRNA in ribosomal fractions from (b). Fractions associated with <3 ribosomes were grouped together to represent poorly translated mRNAs and fractions with >3 ribosomes were grouped as efficiently translated mRNAs. PD-L1 mRNA expression in each fraction was normalized to Luciferase and PD-L1 mRNA abundance was calculated as the percent of total PD-L1 in all fractions. Luciferase mRNA control was added to each fraction prior to RNA extraction to control for variability in total RNA in fractions during the RNA isolation and reverse transcription reactions. Error bars in c and d represent SDs from the mean from three independent fractions (<3 or >3 ribosomes). A student’s two-tailed t-test was performed to determine statistical significance. *p=0.017; **p= 0.001. Data from individual ribosomal fractions for two independent primer pairs are provided in Extended Data Fig. 6b-e. e, Schematic of the wildtype human PD-L1 5´ UTR with five upstream CTGs cloned upstream of a Firefly luciferase reporter. f, Dual-luciferase assay of MEF cells transfected with the indicated firefly luciferase reporter constructs normalized to co-transfected control Renilla luciferase reporter. Error bars represent SDs from the mean for n=3 biological replicates. A student’s two-tailed t-test was performed to determine statistical significance. **** = p<0.0001 for all constructs except M1 (p=0.14). Data from a single experiment are shown in (f) and are representative of three independent experiments with similar results. g, Dual luciferase reporter analysis of the PD-L1 5′ UTR in H358 cells expressing a control or UROD sgRNA. Error bars represent SDs from the mean relative luciferase activity (Firefly/Renilla) across n=3 biological replicates per group. A student’s two-tailed t-test was performed to assess statistical significance with *p = 0.015. h, Dual luciferase reporter analysis of PD-L1 5’ UTR in MEFs cells with a control or Urod shRNA. Error bars represent SDs from the mean relative luciferase activity (Firefly/Renilla) across n=3 biological replicates per group. A student’s two-tailed t-test was performed to assess statistical significance with **p = 0.0075. Experiments in (g) and (h) were performed two independent times with similar results. Data from a representative experiment are shown.

