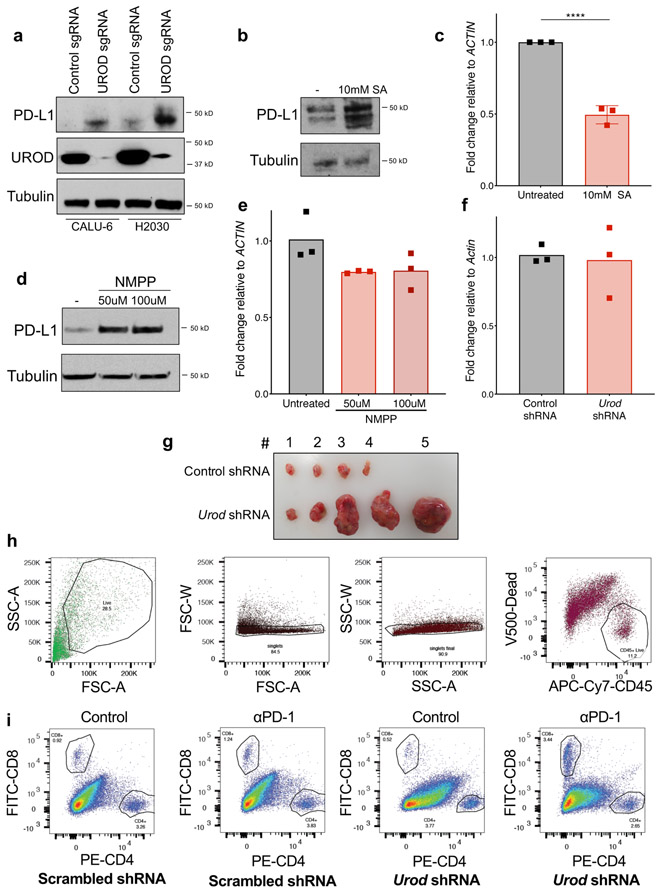
Extended Data Fig. 2. Effects of heme synthesis inhibition on PD-L1 mRNA and protein, and analysis of Pd-l1 mRNA and tumors from LLC cells.
a, Western blot analysis in Calu-6 and H2030 human lung cancer cell lines expressing the indicated sgRNAs. b, Western blot analysis in cells treated with 10 mM succinyl acetone (ALAD inhibitor) for 48h. c, qRT-PCR analysis of PD-L1 mRNA relative to ACTIN, in cells from (b). Error bars represent SDs from the mean for n=3 independent experiments. A student’s two-tailed t-test was used to assess statistical significance with ***p = 0.0002. d, Western blot analysis of PD-L1 in H1944 cells treated with 50 μM or 100 μM N-Methyl Protoporphyrin IX (FECH inhibitor) for 48h. e, qRT-PCR analysis of PD-L1 mRNA in cells from (d). Data represent mean PD-L1 mRNA expression normalized to ACTIN across n=3 technical replicates, shown as individual data points. All experiments in a-b and d-e were performed two independent times, with similar results. Data from representative experiments are shown. f, qRT-PCR analysis of Pd-l1 mRNA normalized to Actin in LLC cells expressing control or Urod shRNA. Bar graph represents mean normalized Pd-l1 mRNA from n=3 technical replicates, shown as individual data points from a representative experiment. Experiment were performed two independent times with similar results. g, Representative images of LLC tumors expressing control or Urod shRNA. This experiment was repeated twice with similar results. h, Gating strategy for TIL staining of tumors. Cells were gated based on SSC and FSC. Singlet cells were then gated for APC-Cy7-CD45+ and eFLUOR V500+ dead cells were excluded. i, Representative gating for CD4+ and CD8+ cells in one tumor from each experimental group. CD45+ live cells from each group was obtained by gating as in (h) and then gated for FITC-CD8+ and PE-CD4+ cells to obtain % CD8+ (of CD45+ cells).

