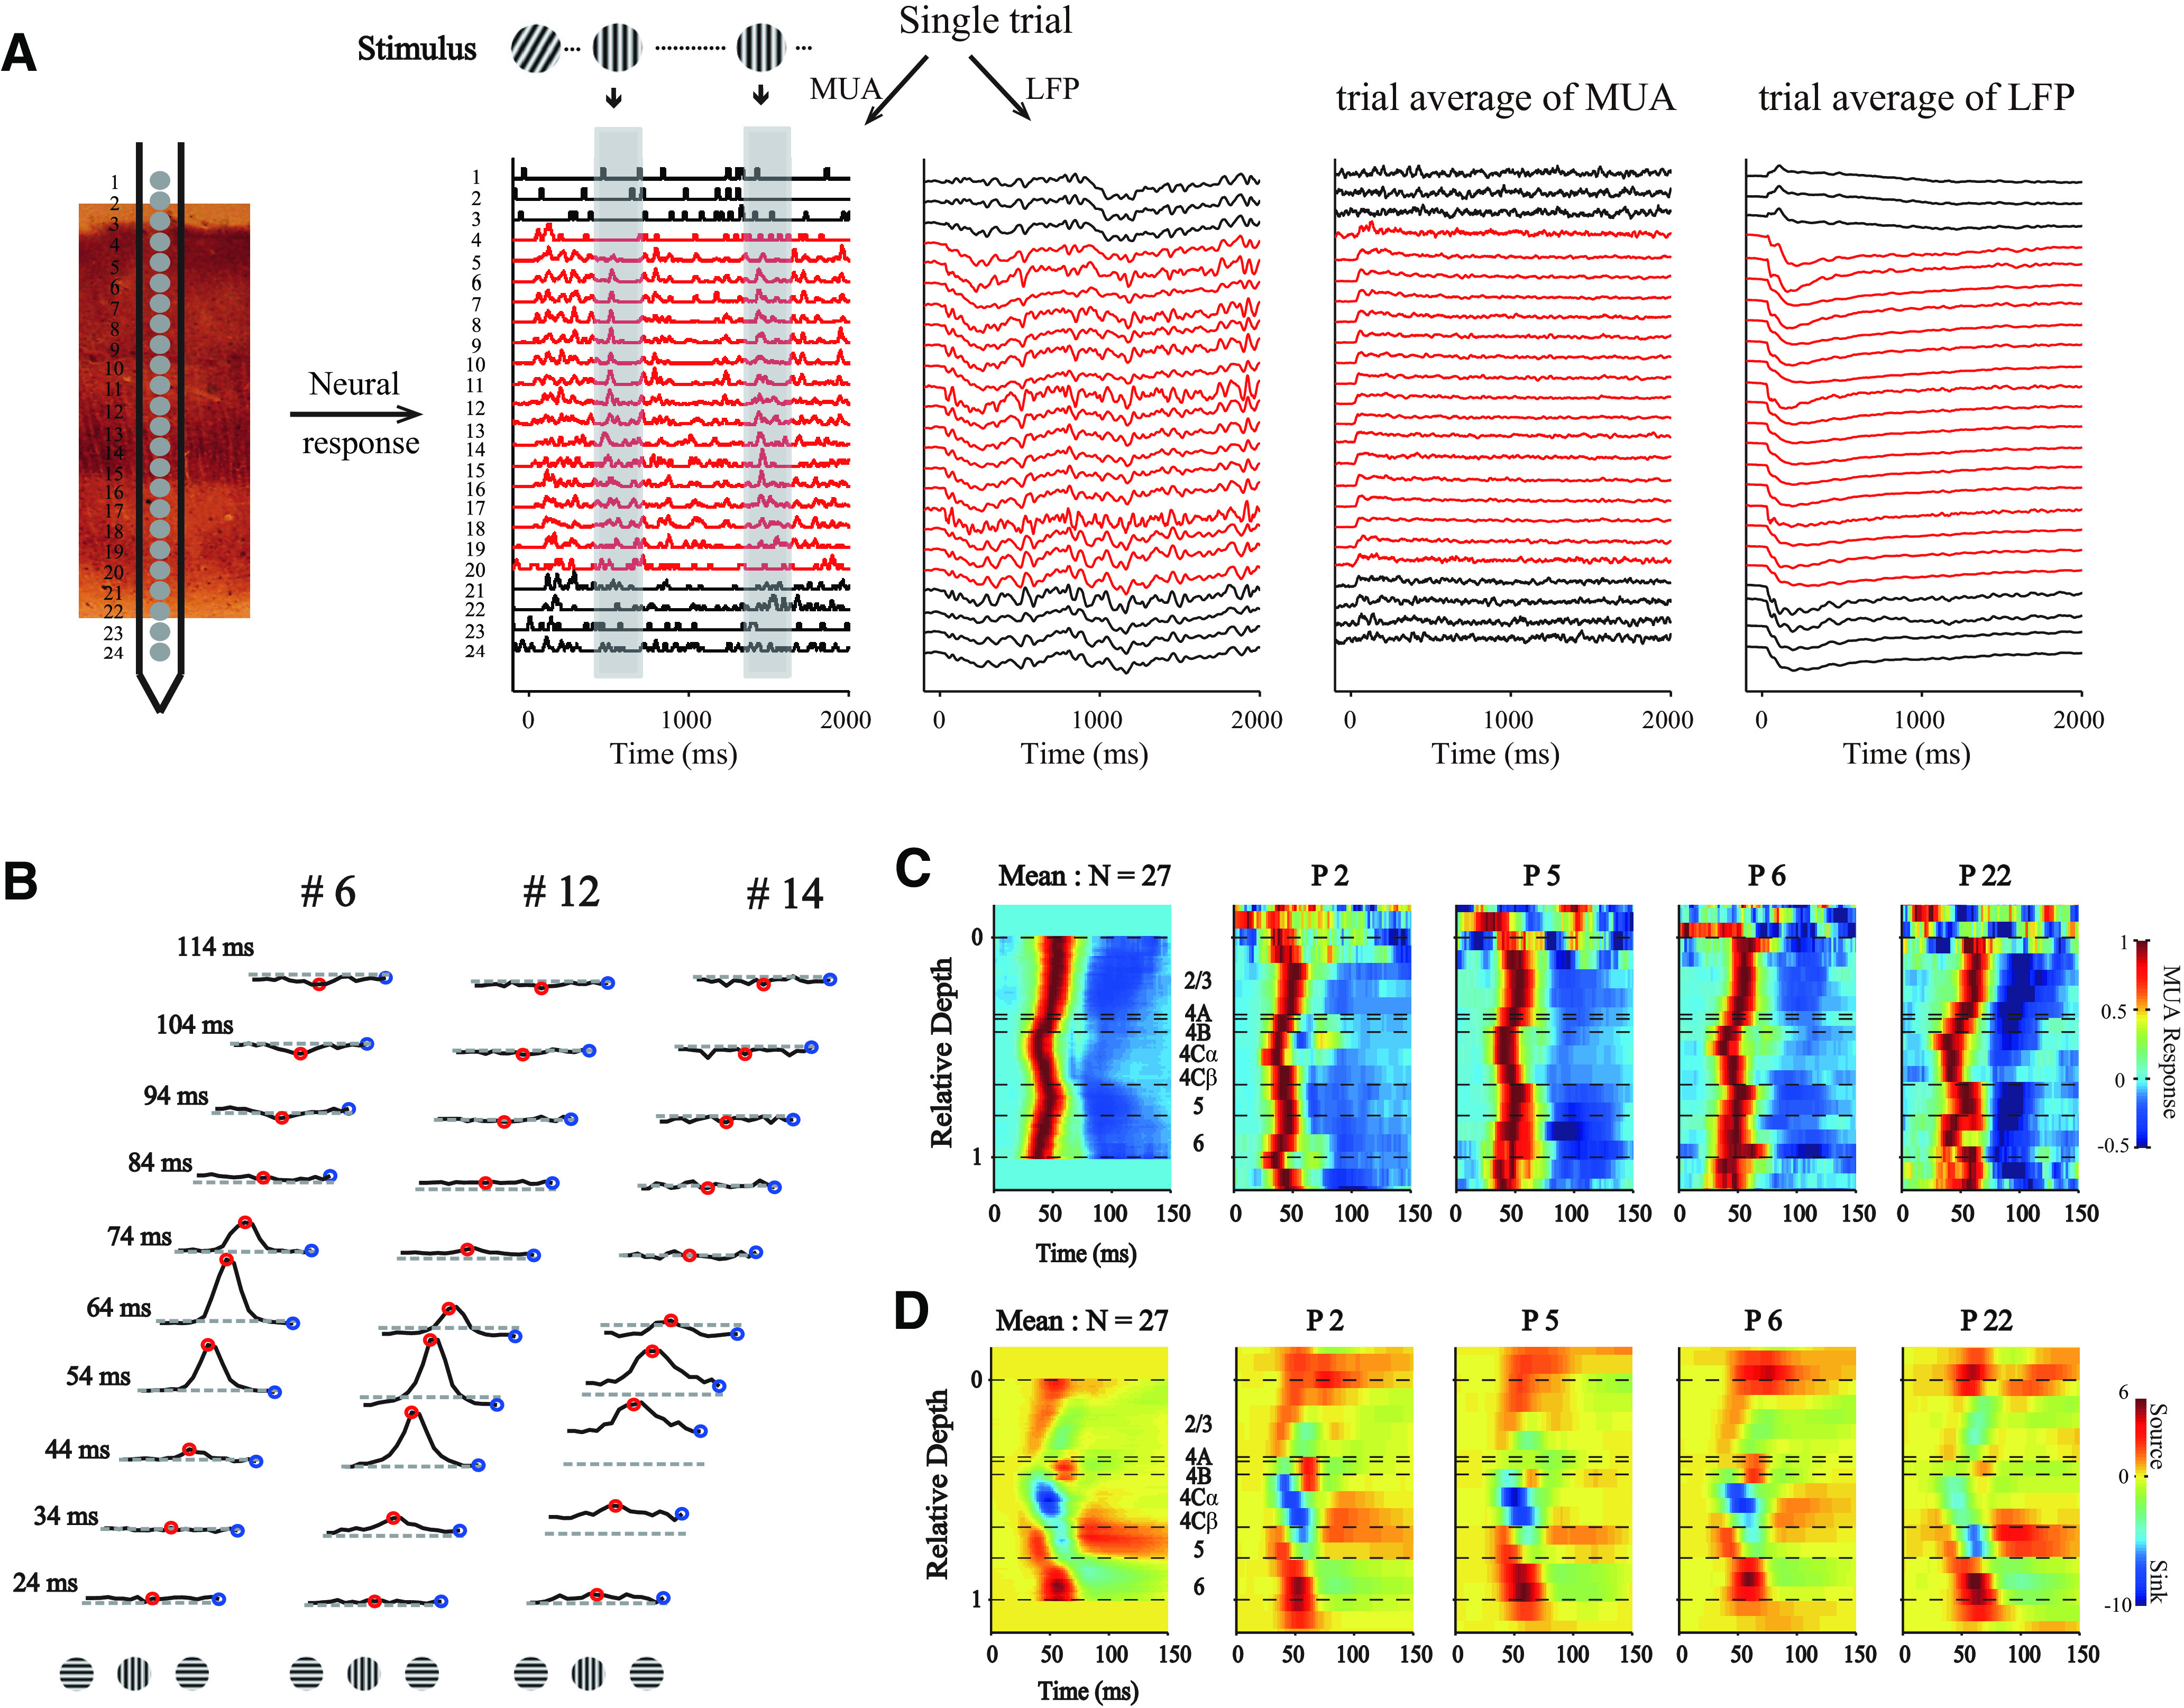
Figure 1.

Simultaneous recordings of multiple sites throughout V1 layers. A, Methods for laminar recording and reverse correlation. Left, Neural activity was recorded with U-Probe (Plexon, 24 channels, interchannel spacing 100 μm). The linear array was positioned vertically through the full depth of V1. Right, Demonstration of single trial and trial averages for MUA and LFP. Stimuli with different orientations were flashed for 20 ms in a random sequence. Shaded area represents the time window (−50 to 250 ms) for the triggered average. The neural activity of each channel was recorded with 2 ms resolution. Red represents sites within V1. B, Dynamics of orientation tuning of the MUA at three example sites at different cortical depths from the probe placement in A. Tuning curves were plotted every 10 ms, starting at 24 ms after stimulus onset and ending at 114 ms after stimulus onset. Red points represent the responses of the site to orientation at 0° (its preferred orientation). Blue points represent the responses of cells to orientation at 90° (orthogonal to preferred orientation). The tuning curves of each site were shifted, so that the preferred orientation was set to 0°. Dashed lines indicate the responses to a blank stimulus. C, Laminar pattern of MUA from 1 animal (DD). For each probe placement (P), the averaged responses of MUA to all orientations were calculated. Patterns in first column were averaged from all probe placements in this animal (N = 27). The relative cortical depth was determined by signatures of MUA and CSD (see Materials and Methods). Horizontal black dashed lines indicate the laminar boundaries. D, Similar to C, but for CSD of the same probe placements. Each CSD pattern was normalized by its SD.
