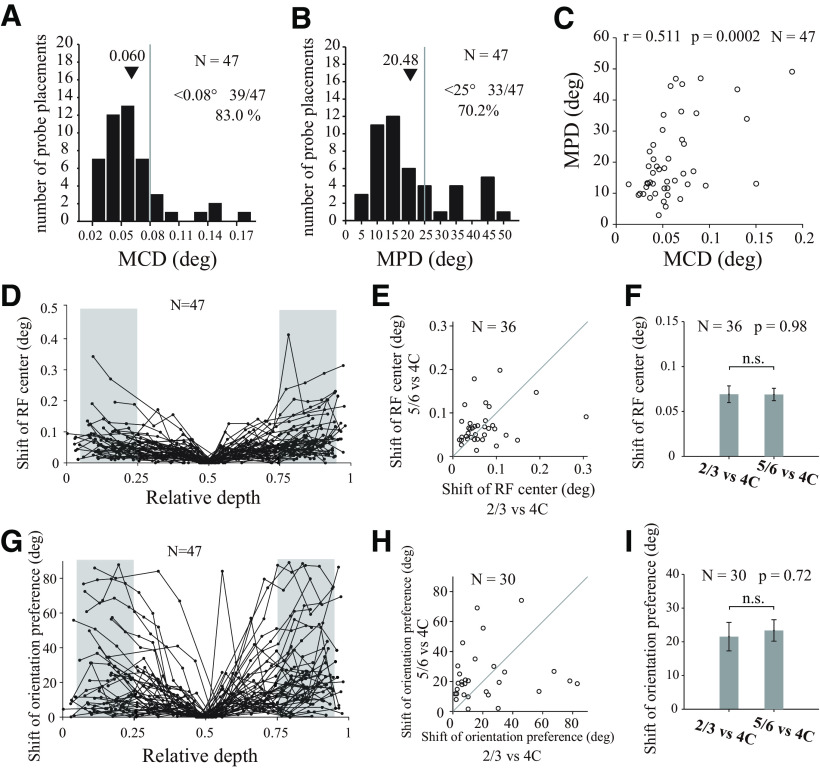
Figure 10.
Shifts of RF centers and orientation preferences. A, Distribution for MCDs from individual probe placement (N = 47 sessions). Black triangles represent mean value of the MCDs in all sessions. Gray dashed line indicates the threshold (0.08°). MCDs <0.08 visual angle occupy 83.0% (39 of 47) sessions. B, Distribution for mean value of absolute differences of orientation preferences (MPD) from individual probe placement (N = 47 sessions). Gray dashed line indicates the threshold (25°). MPDs <25°occupy 70.2% (33 of 47) sessions. C, Relationship between MCDs and MPDs for all valid probe placements. D, Shift of RF centers against relative depth. The shift of RF center of each recording site was defined as the center distance between the site's RF center and the RF center of L4C in the same probe placement (the site nearest to relative depth of 0.5). Each dotted line indicates 1 probe placement. Shaded areas represent regions in L2/3 or L5/6 (located at L2/3 and L5/6; range of relative depth, 0.05-0.25 for L2/3, 0.75-0.95 for L5/6) for further analysis in E and F. E, Scatter plot for shift of RF centers in L2/3 (relative to L4C in the same probe placement) against shift of RF center in L5/6 (relative to L4C in the same probe placement). Probe placements (N = 36) were included if L2/3, L4C, and L5/6 all have valid recording sites. F, Average shift of RF centers in L2/3 and L5/6 (both are relative to L4C; paired t test; n.s., not significant). G–I, Similar to D–F, but for shift of orientation preferences.

