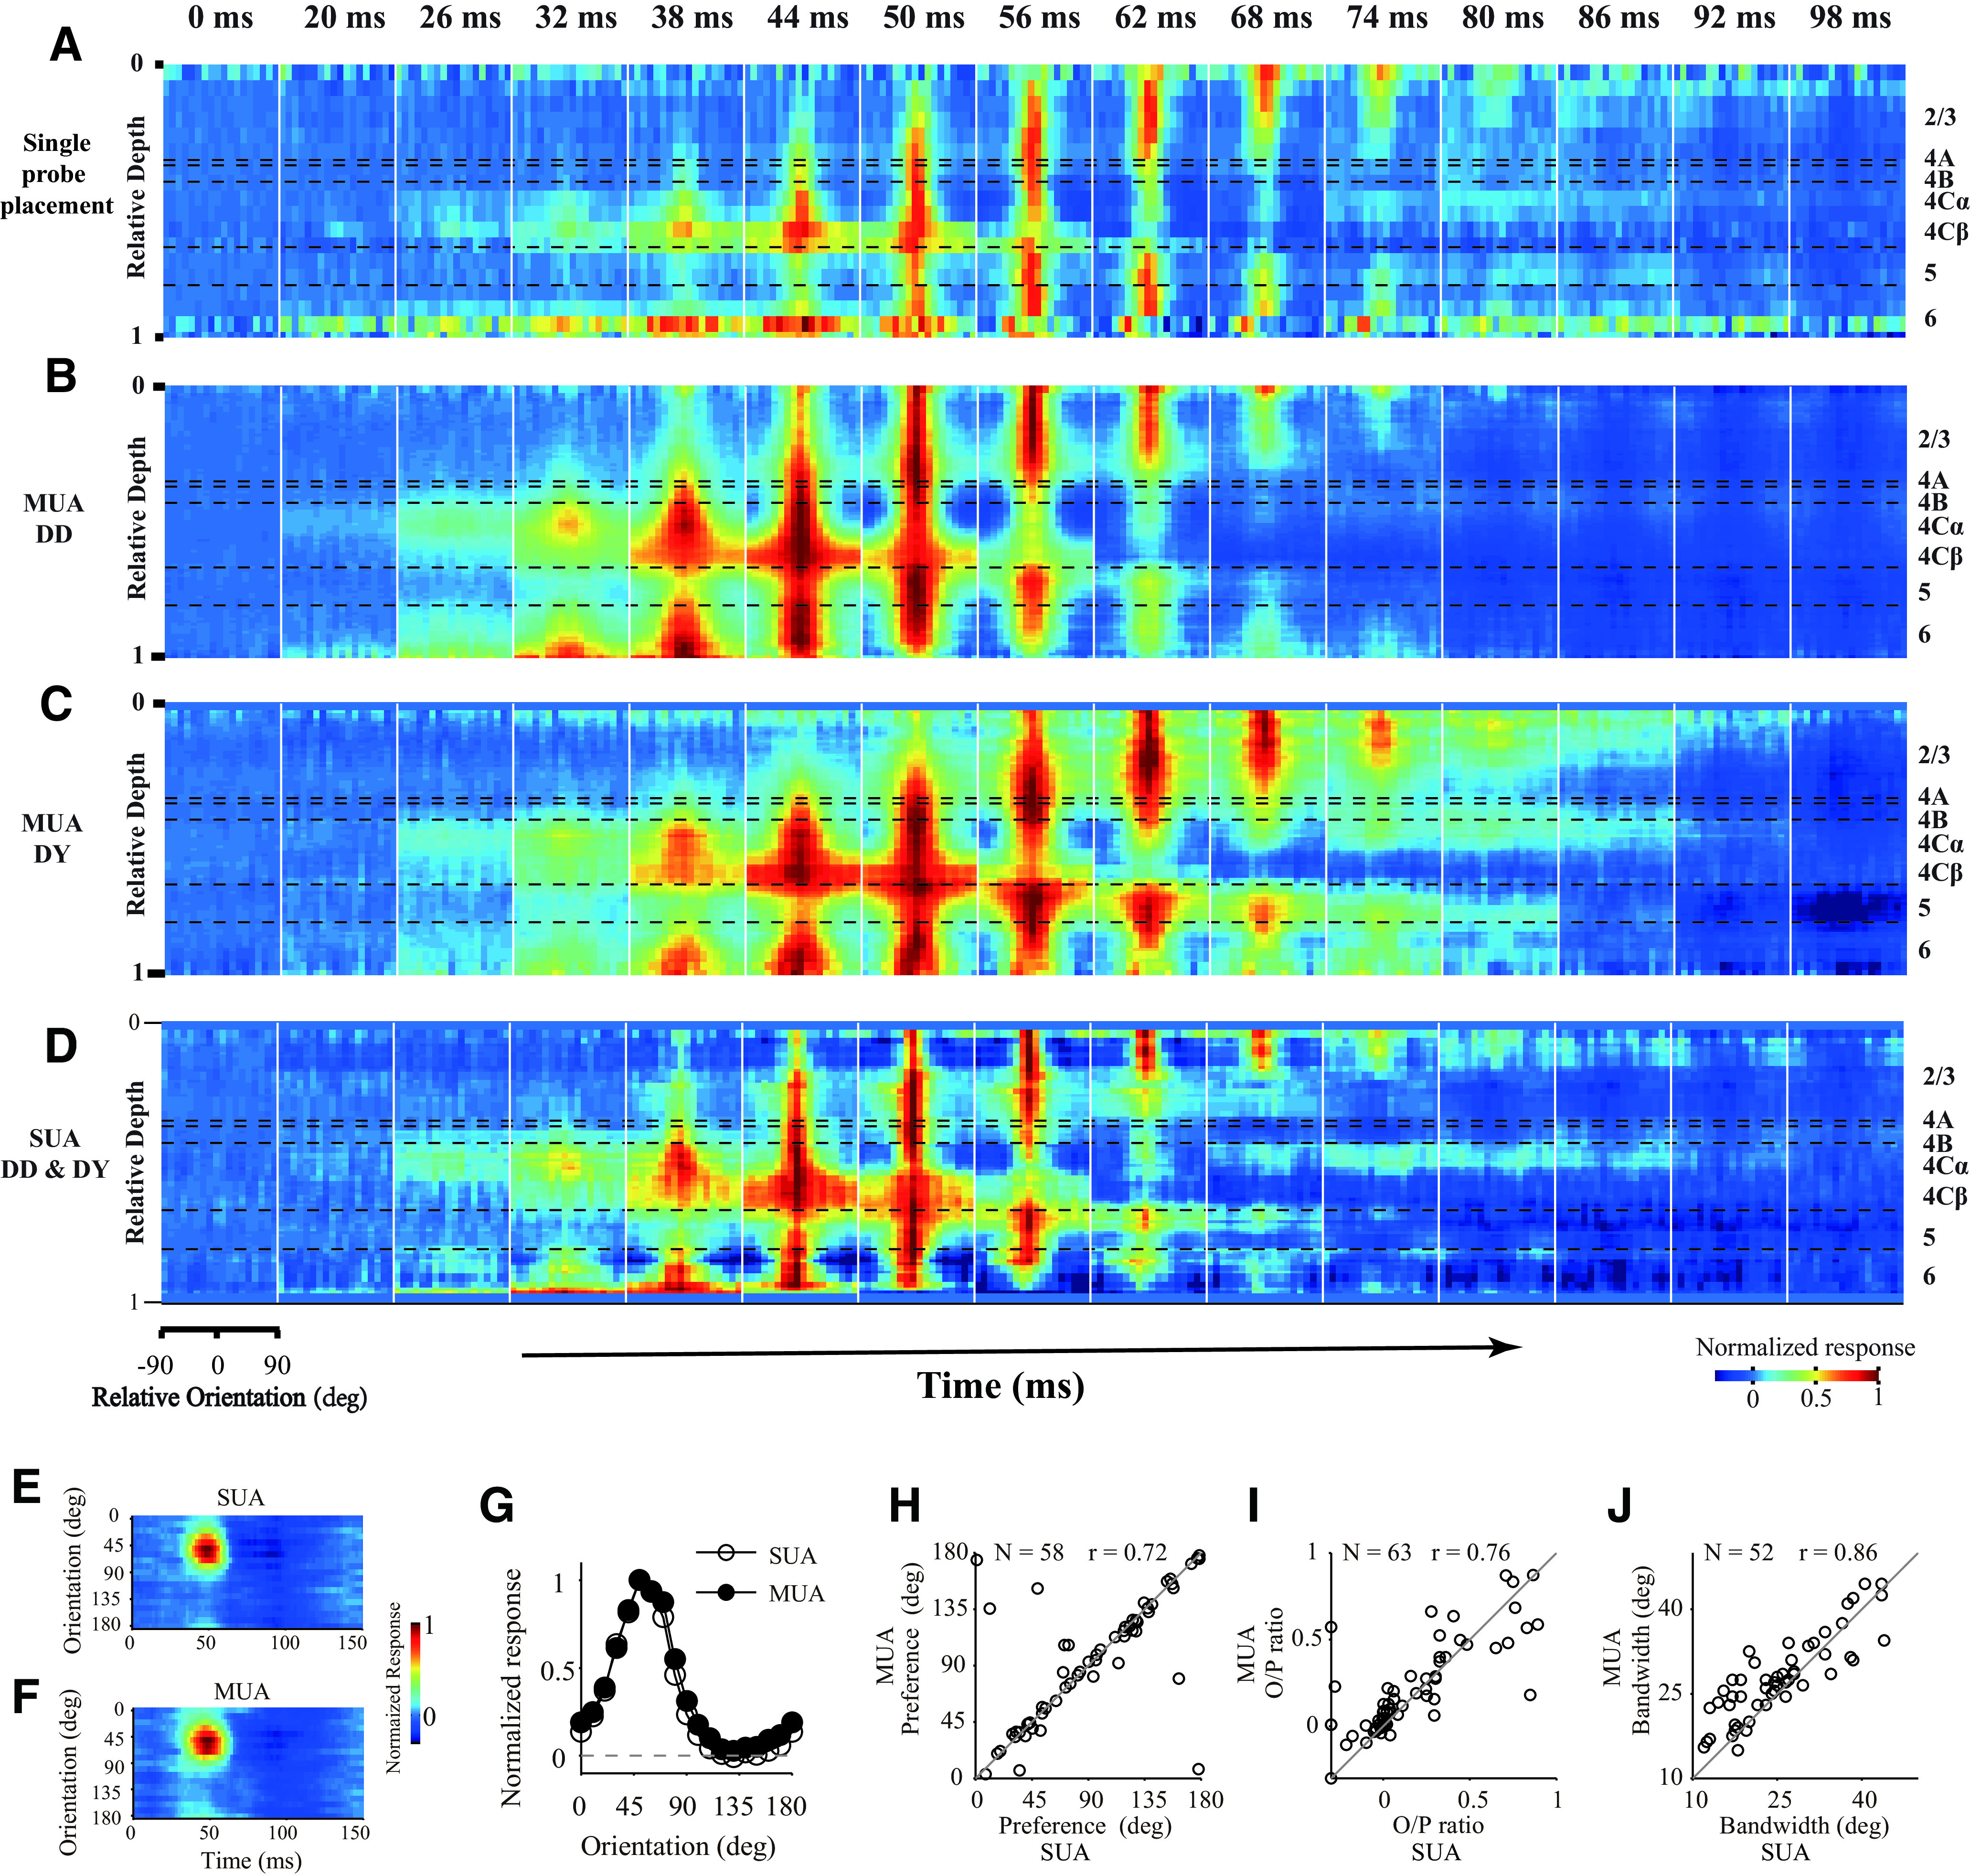
Figure 2.

Population-averaged laminar pattern of orientation dynamics. A, Laminar pattern of orientation dynamics in a single probe placement. The snapshots were plotted starting at 0 ms; then every 6 ms was selected from 20 to 98 ms after stimulus onset. Each snapshot shows orientation tuning at all depths within V1. MUA response strength was coded by color. Each site's response was normalized by its maximum value. The length of the sliding window for averaging across depth is 0.1 (relative depth). Horizontal black dashed lines indicate the laminar boundaries. B, C, Similar to A, but averaged from multiple probe placements. B, Averaged from 1 animal (DD, MUA; N = 293). C, Averaged from another animal (DY, MUA; N = 114). D, Averaged from 70 SUAs of 2 animals (DD, N = 58; DY, N = 12). Color scale applies to A–D. E, An example for orientation dynamics of single unit (SUA) from experiment DD2-u035-003, channel #5. F, Orientation dynamics of MUA from the same recording site as in E. G, Orientation tuning of the example site (same as in E and F). The tuning averaged from 36 to 58 ms shown in E and F. Open circles represent SUA. Solid circles represent MUA. H, The comparison of orientation preferences between SUA and MUA (N = 58, FitR > 0.45). Circular correlation coefficient (r) is 0.72. I, The comparison of O/P ratio between SUA and MUA (N = 63, FitR > 0.1). Pearson's correlation coefficient (r) is 0.76. J, The comparison of orientation bandwidth between SUA and MUA (N = 52, FitR > 0.6). Pearson's correlation coefficient (r) is 0.86 (for details of the measurement of O/P ratio and bandwidth, see Materials and Methods).
