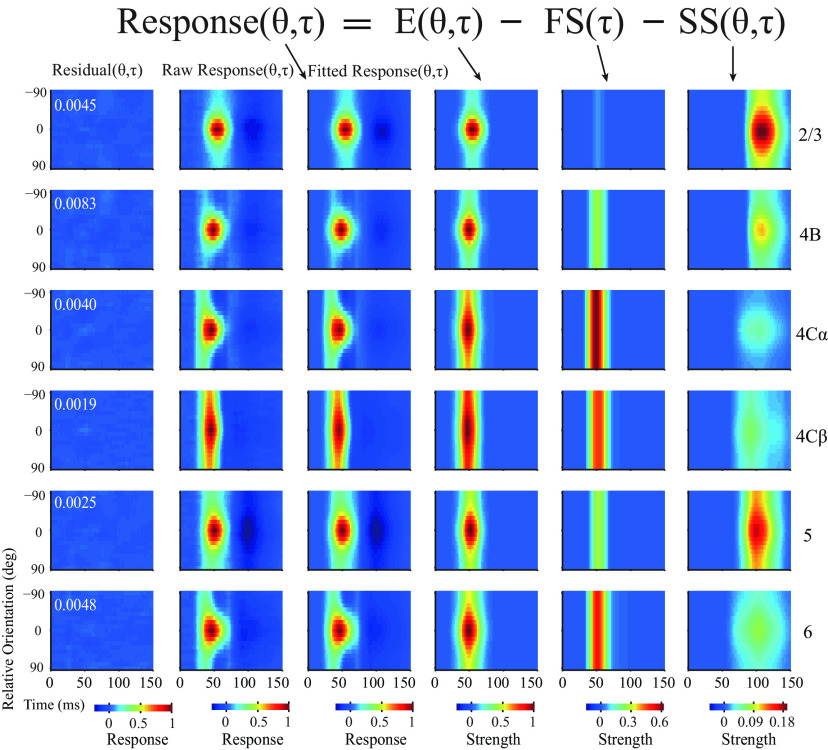
Figure 3.
Three-component model for dynamic orientation tuning across V1 layers. Fitting population-averaged orientation dynamics within different layers used a three-component model. Different columns represent different aspects relative to model fitting. Different rows represent different layers. The second column represents raw normalized response (raw response). The third column represents the model fitted response pattern (fitted response). The first column represents the residual pattern (residual = raw response − fitted response). White numbers inset in the top left corner of each residual plot indicate the summed fitting error. The fourth to sixth columns represent three components (E, excitation; FS, fast suppression; SS, slow suppression) dissected from the dynamic response.

