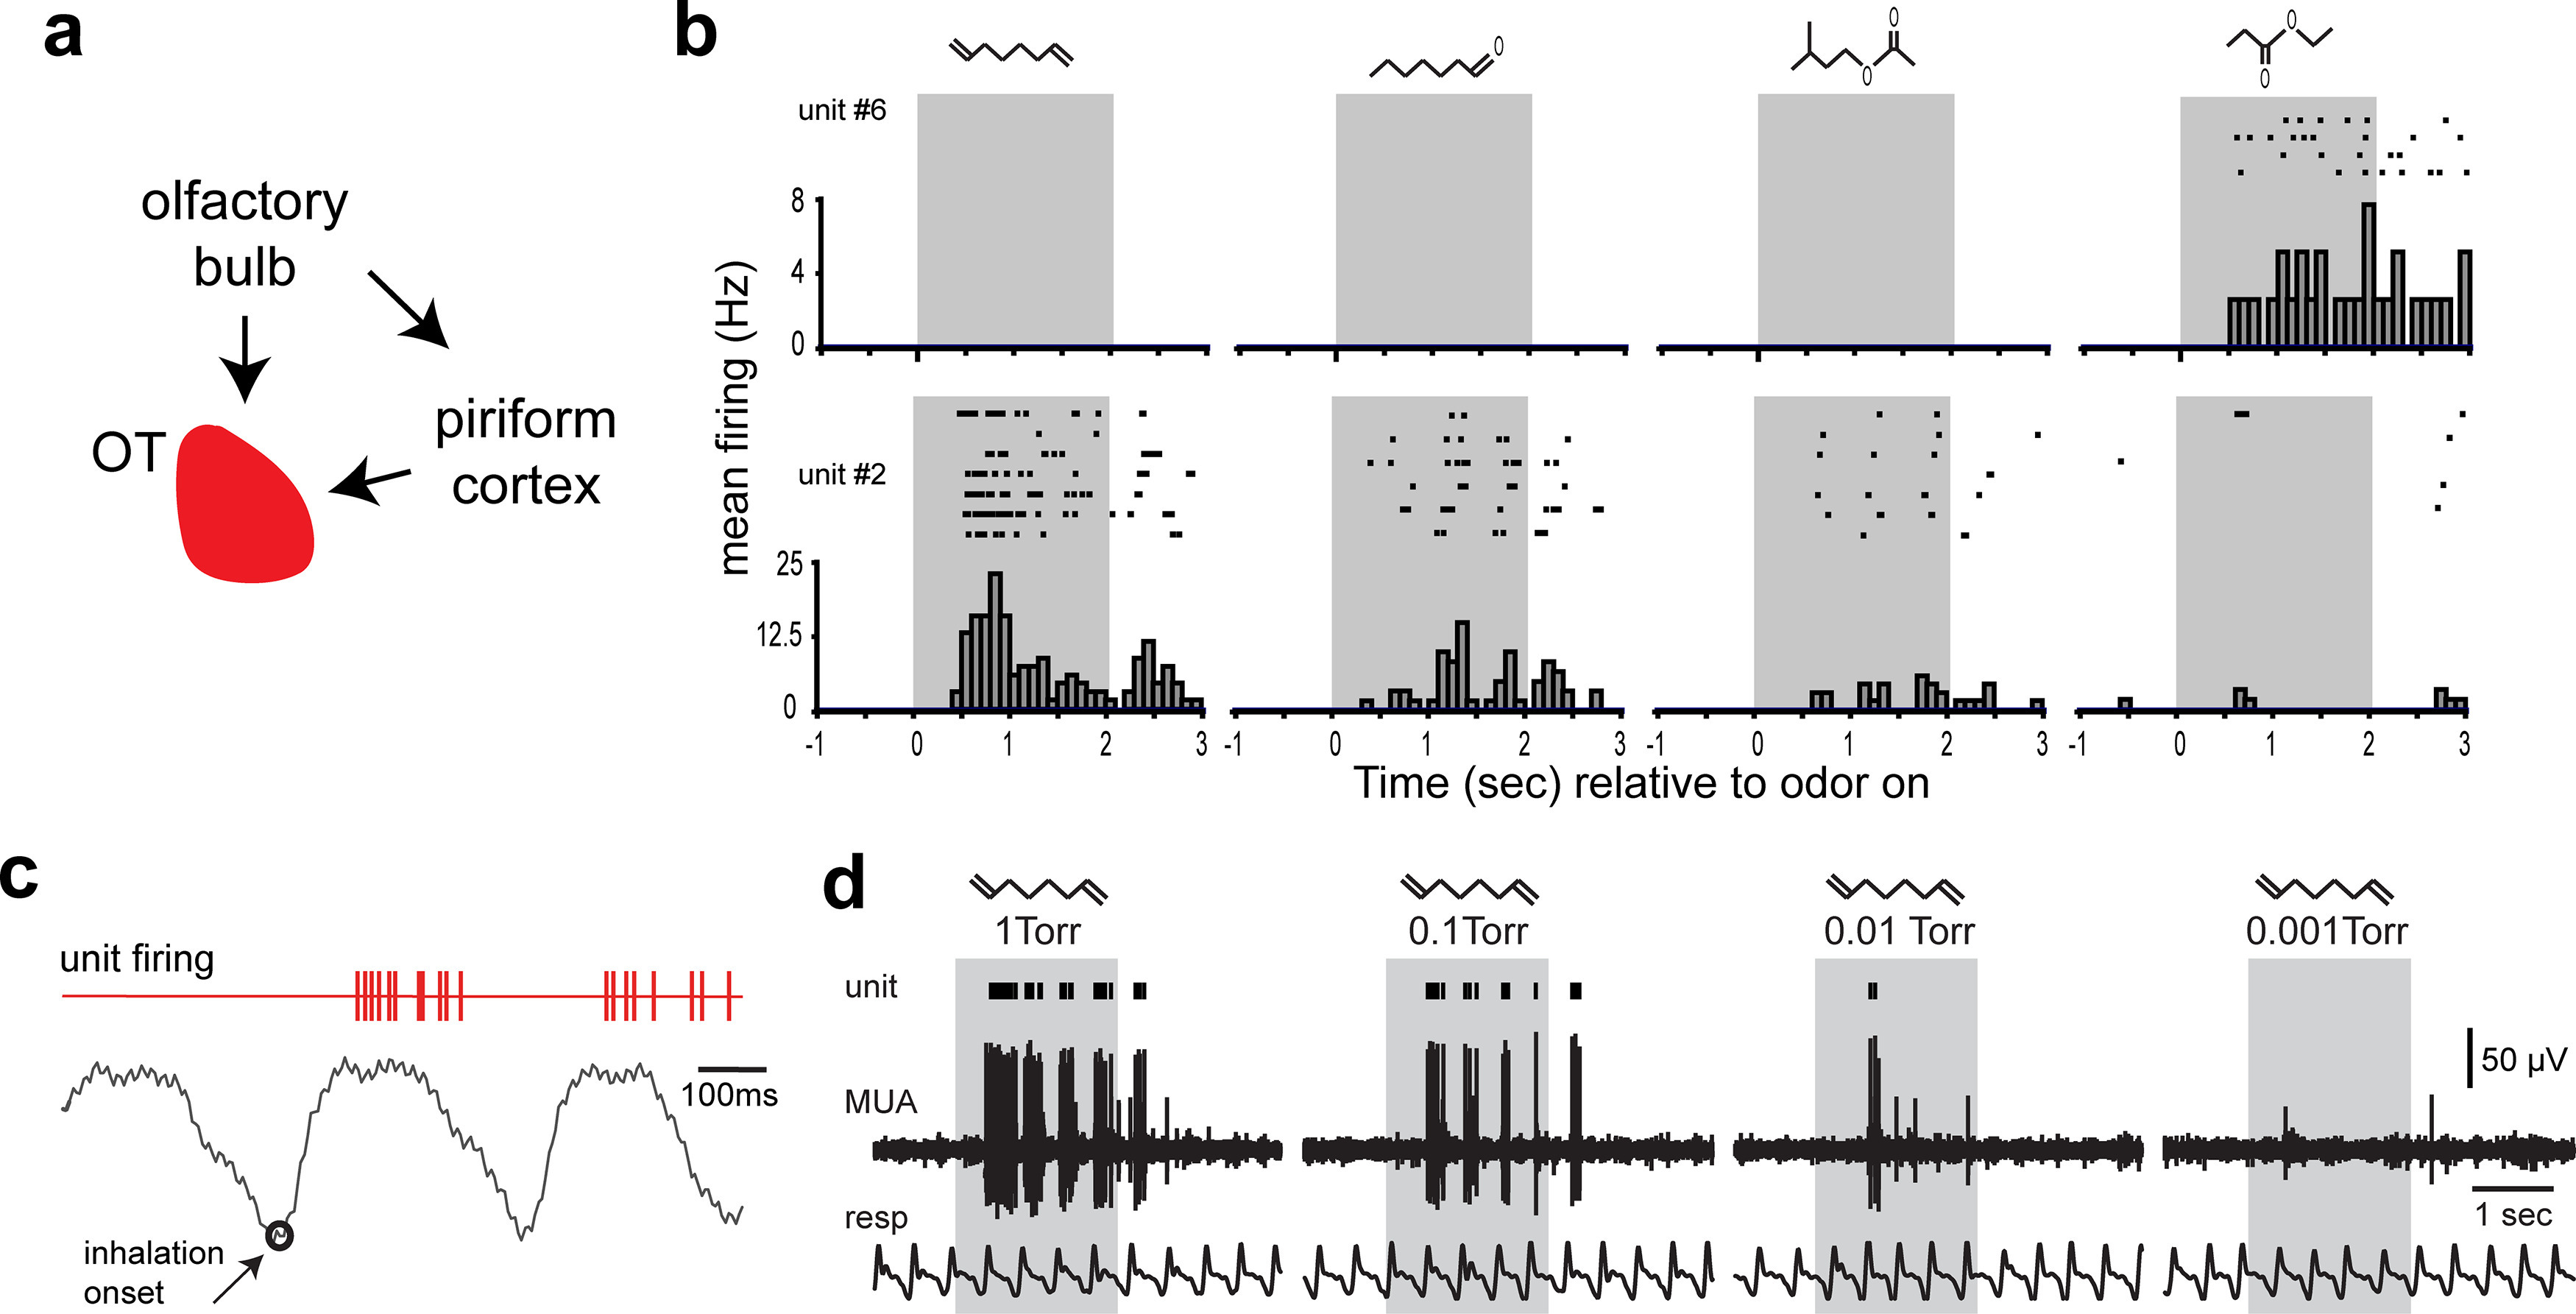
Figure 2.

Odor input into the OT and the representation of odors by OT neurons. a, Schematic of the major sources of odor information into the OT, including from the olfactory bulb and piriform cortex, which receives direct input from the olfactory bulb to extend disynaptic input to the OT. Data from Gurdjian (1925), L. E. White (1965), Scott et al. (1980), and Schwob and Price (1984b). b, Example of odor-evoked activity in two OT single units from two separate urethane-anesthetized mice. Data are single-unit raster plots and peristimulus time histograms across multiple presentations with four different odorants (from left to right: 1,7-octadiene, ethyl propionate, heptanal, and isoamyl acetate). The top unit displays narrow tuning, responding to only one of the odorants, whereas the bottom unit responds to several odorants. Data adapted from Wesson and Wilson (2010). c, Example single-unit raster of spiking events (red) during odor presentation in relation to respiratory cycles, indicating the short latency until spiking from this unit relative to the onset of inhalation (open circle). Data adapted from Payton et al. (2012). d, Example multiunit OT trace (MUA) and single-unit raster plot (unit) along with respiration (resp) from a single recording in a urethane-anesthetized mouse showing reduction in spiking with decreased intensities of a single odor (1,7-octadiene). Whereas the 1 torr intensity odor elicited robust spiking during most inhalation events, the single unit in this example did not spike to the lowest intensity. Data adapted from Xia et al. (2015).
