Figure 4.
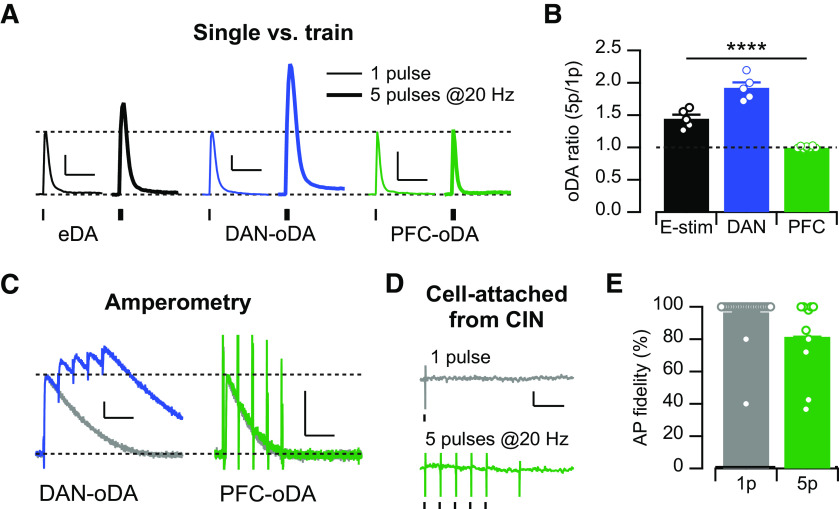
PFC-oDA shows no summation by train stimulations. A, Representative DA traces of eDA, DAN-oDA, and PFC-oDA transients evoked by single pulse (1p, thin traces) or train of 5 pulses at 20 Hz (5p, thick traces). Scale bar, 200 nM, 2 s. B, Averages with SEM of the DA amplitude ratio (5p/1p) for eDA, DAN-oDA, and PFC-oDA transients were plotted. Open circles represent individual values. C, Representative amperometric traces for DAN-oDA (left) and PFC-oDA (right) transients evoked by single pulse (gray traces) or train of 5 pulses at 20 Hz (color traces). PFC-oDA amperometric transients evoked by 50 at 20 Hz were indistinguishable from 1p stimulation, except the large deflection at the stimulation time for 5p pulses. Scale bars: 200 pA, 100 ms. D, Representative cell-attached recordings from CINs with single (top, gray) or train of 5 pulses at 20 Hz (bottom, green). Scale bars: 20 pA, 100 ms. E, Averages with SEM of the action potential fidelity were plotted for the single pulse and train stimulation. Open circles represent individual values. ****p < 0.0001.

