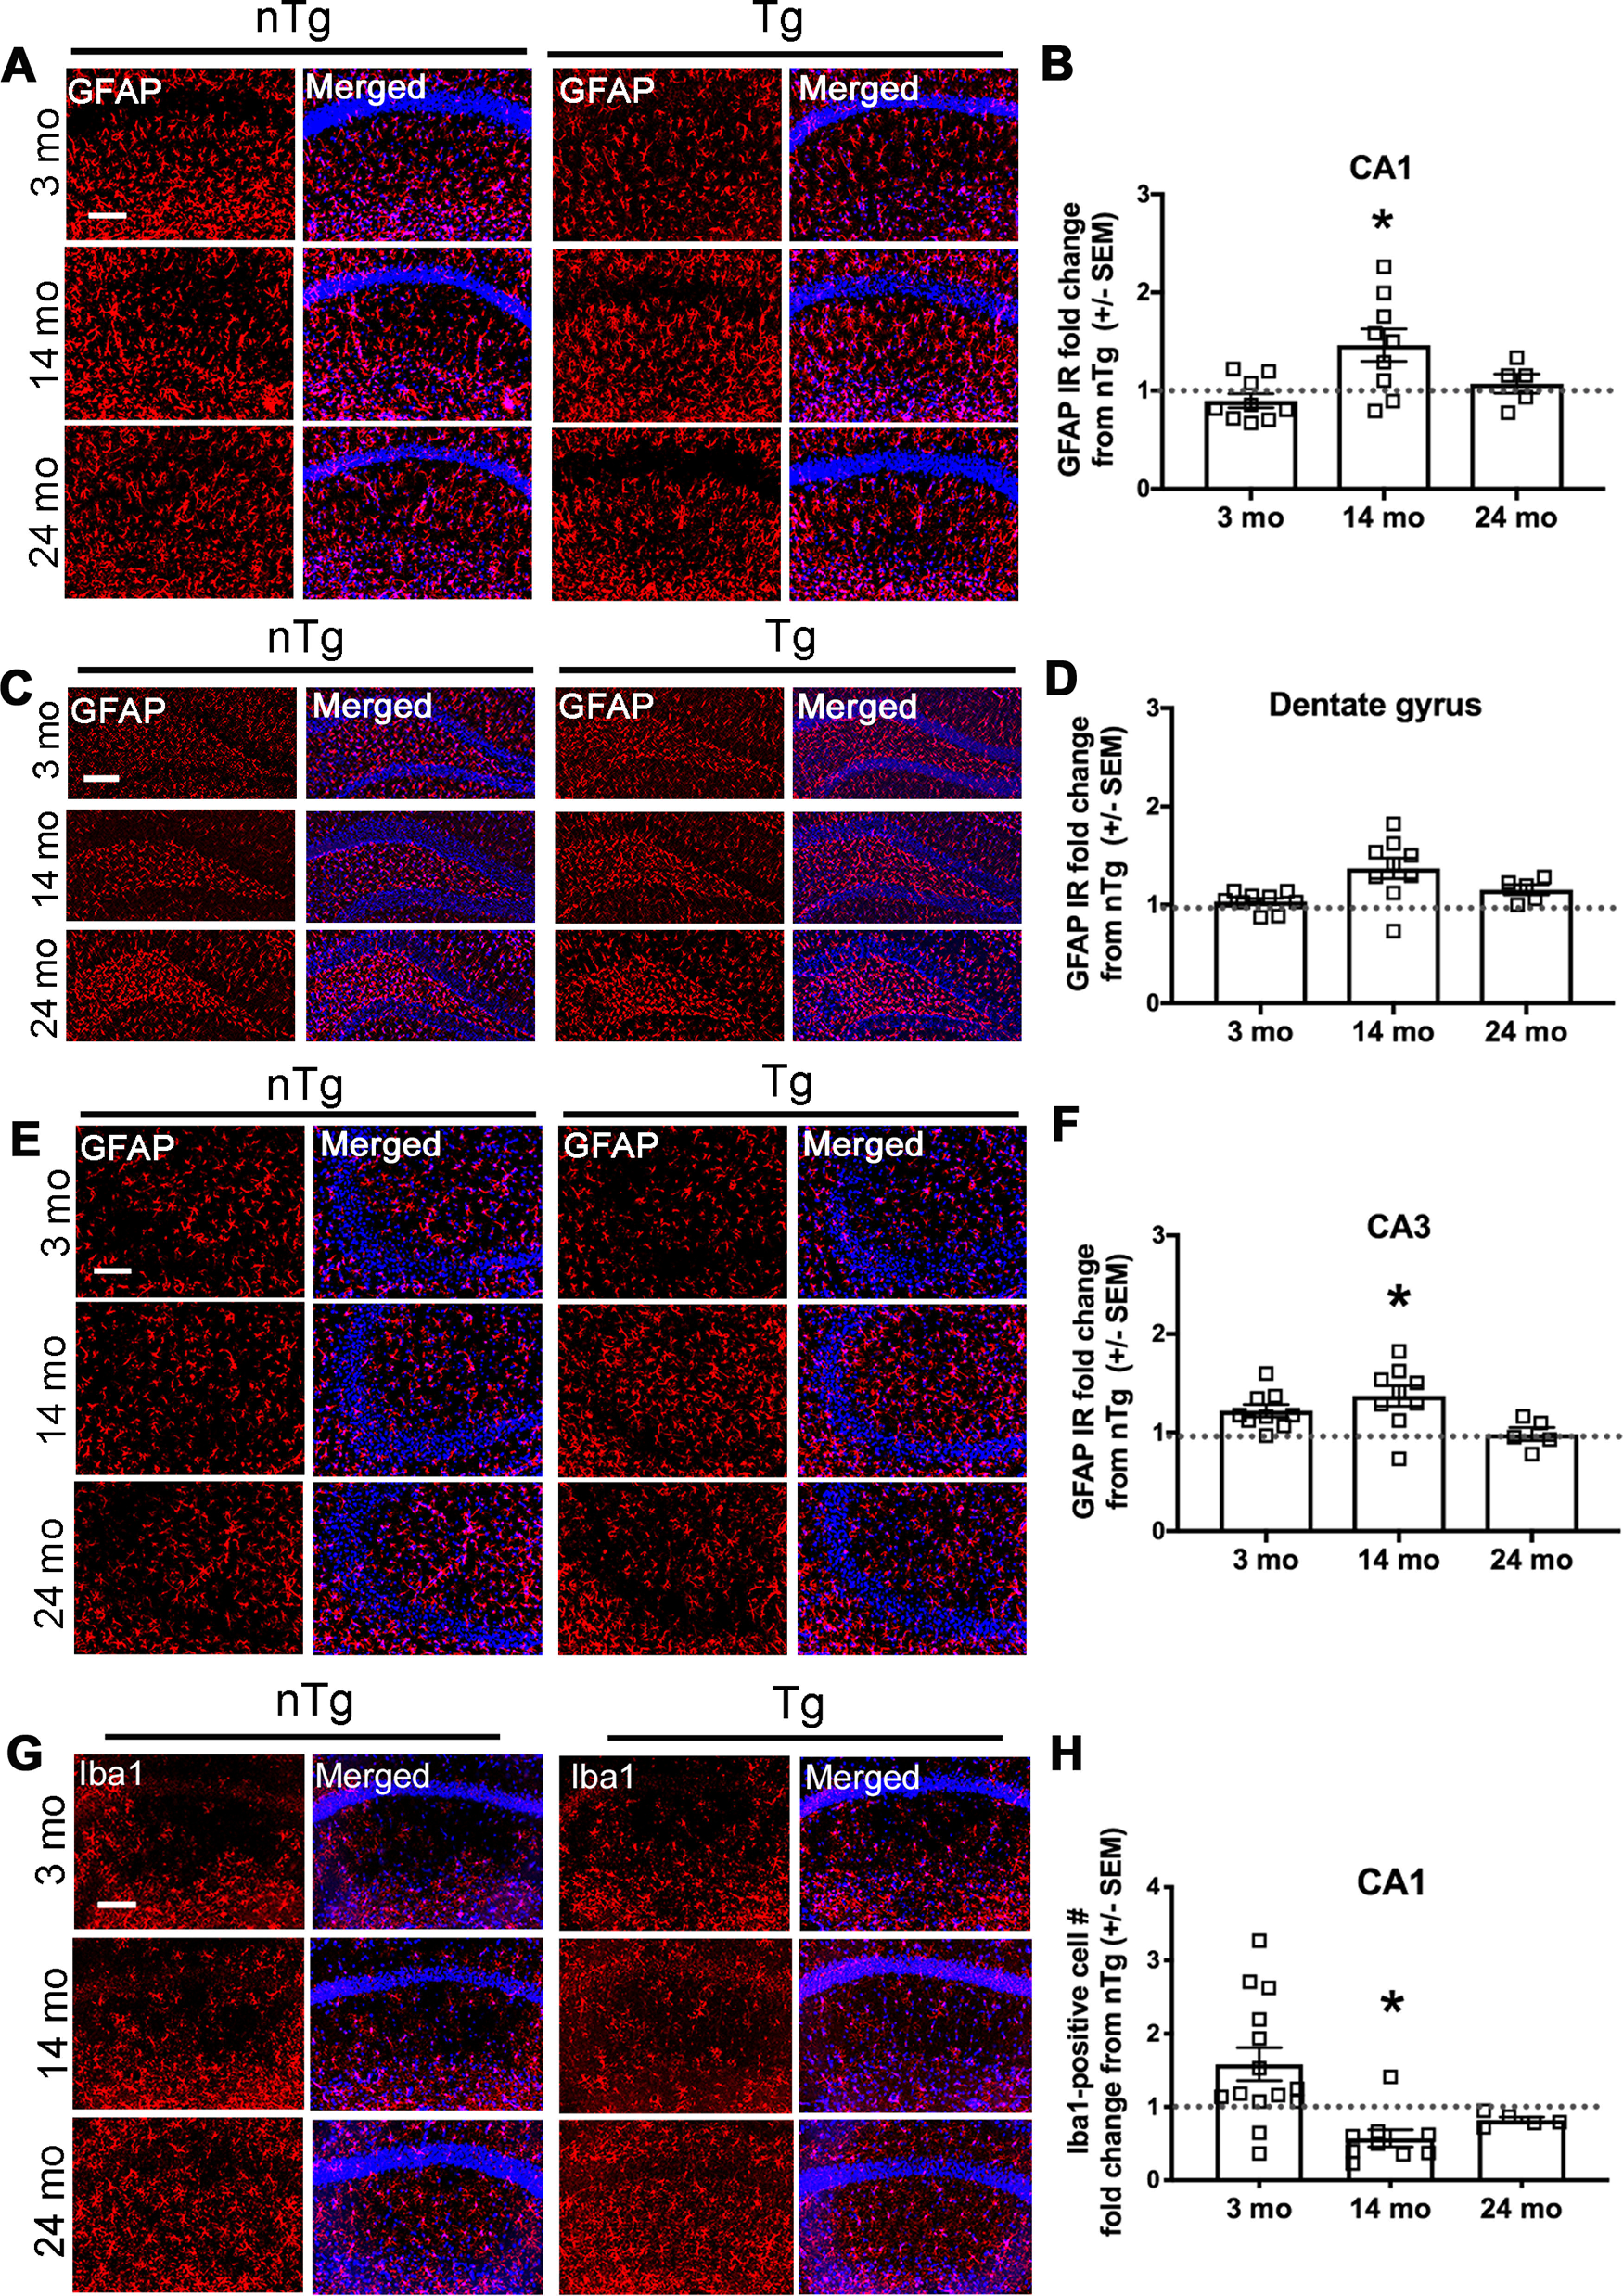
Figure 10.

Hippocampal astrocytic GFAP expression is increased, with fewer Iba1-expressing cells in CA1, in 14-month-old Tg DBH-hSNCA mice. At 14 months, Tg mice have significantly more GFAP (red) expression than nTg mice in the CA1 region of the hippocampus. A, C, E, Representative immunofluorescent images of CA1 (A), dentate gyrus (C), and CA3 (E) regions. B, D, F, Quantification of GFAP IR as the percentage area of the ROI in CA1 (B), dentate gyrus (D), and CA3 (F). At 14 months, Tg mice have fewer Iba1-expressing cells in hippocampal region CA1. G, Representative immunofluorescent images of Iba1-expressing cells (red). H, Quantification of Iba1-expressing cells in CA1 graphed as Tg fold change from nTg mean ± SEM. Nuclear stain in blue. Student's t test of nTg and Tg for each age group, graphed as the mean ± SEM fold change in Tg from nTg. Scale bar, 150 µm. *p < 0.05.
