
Figure 1.
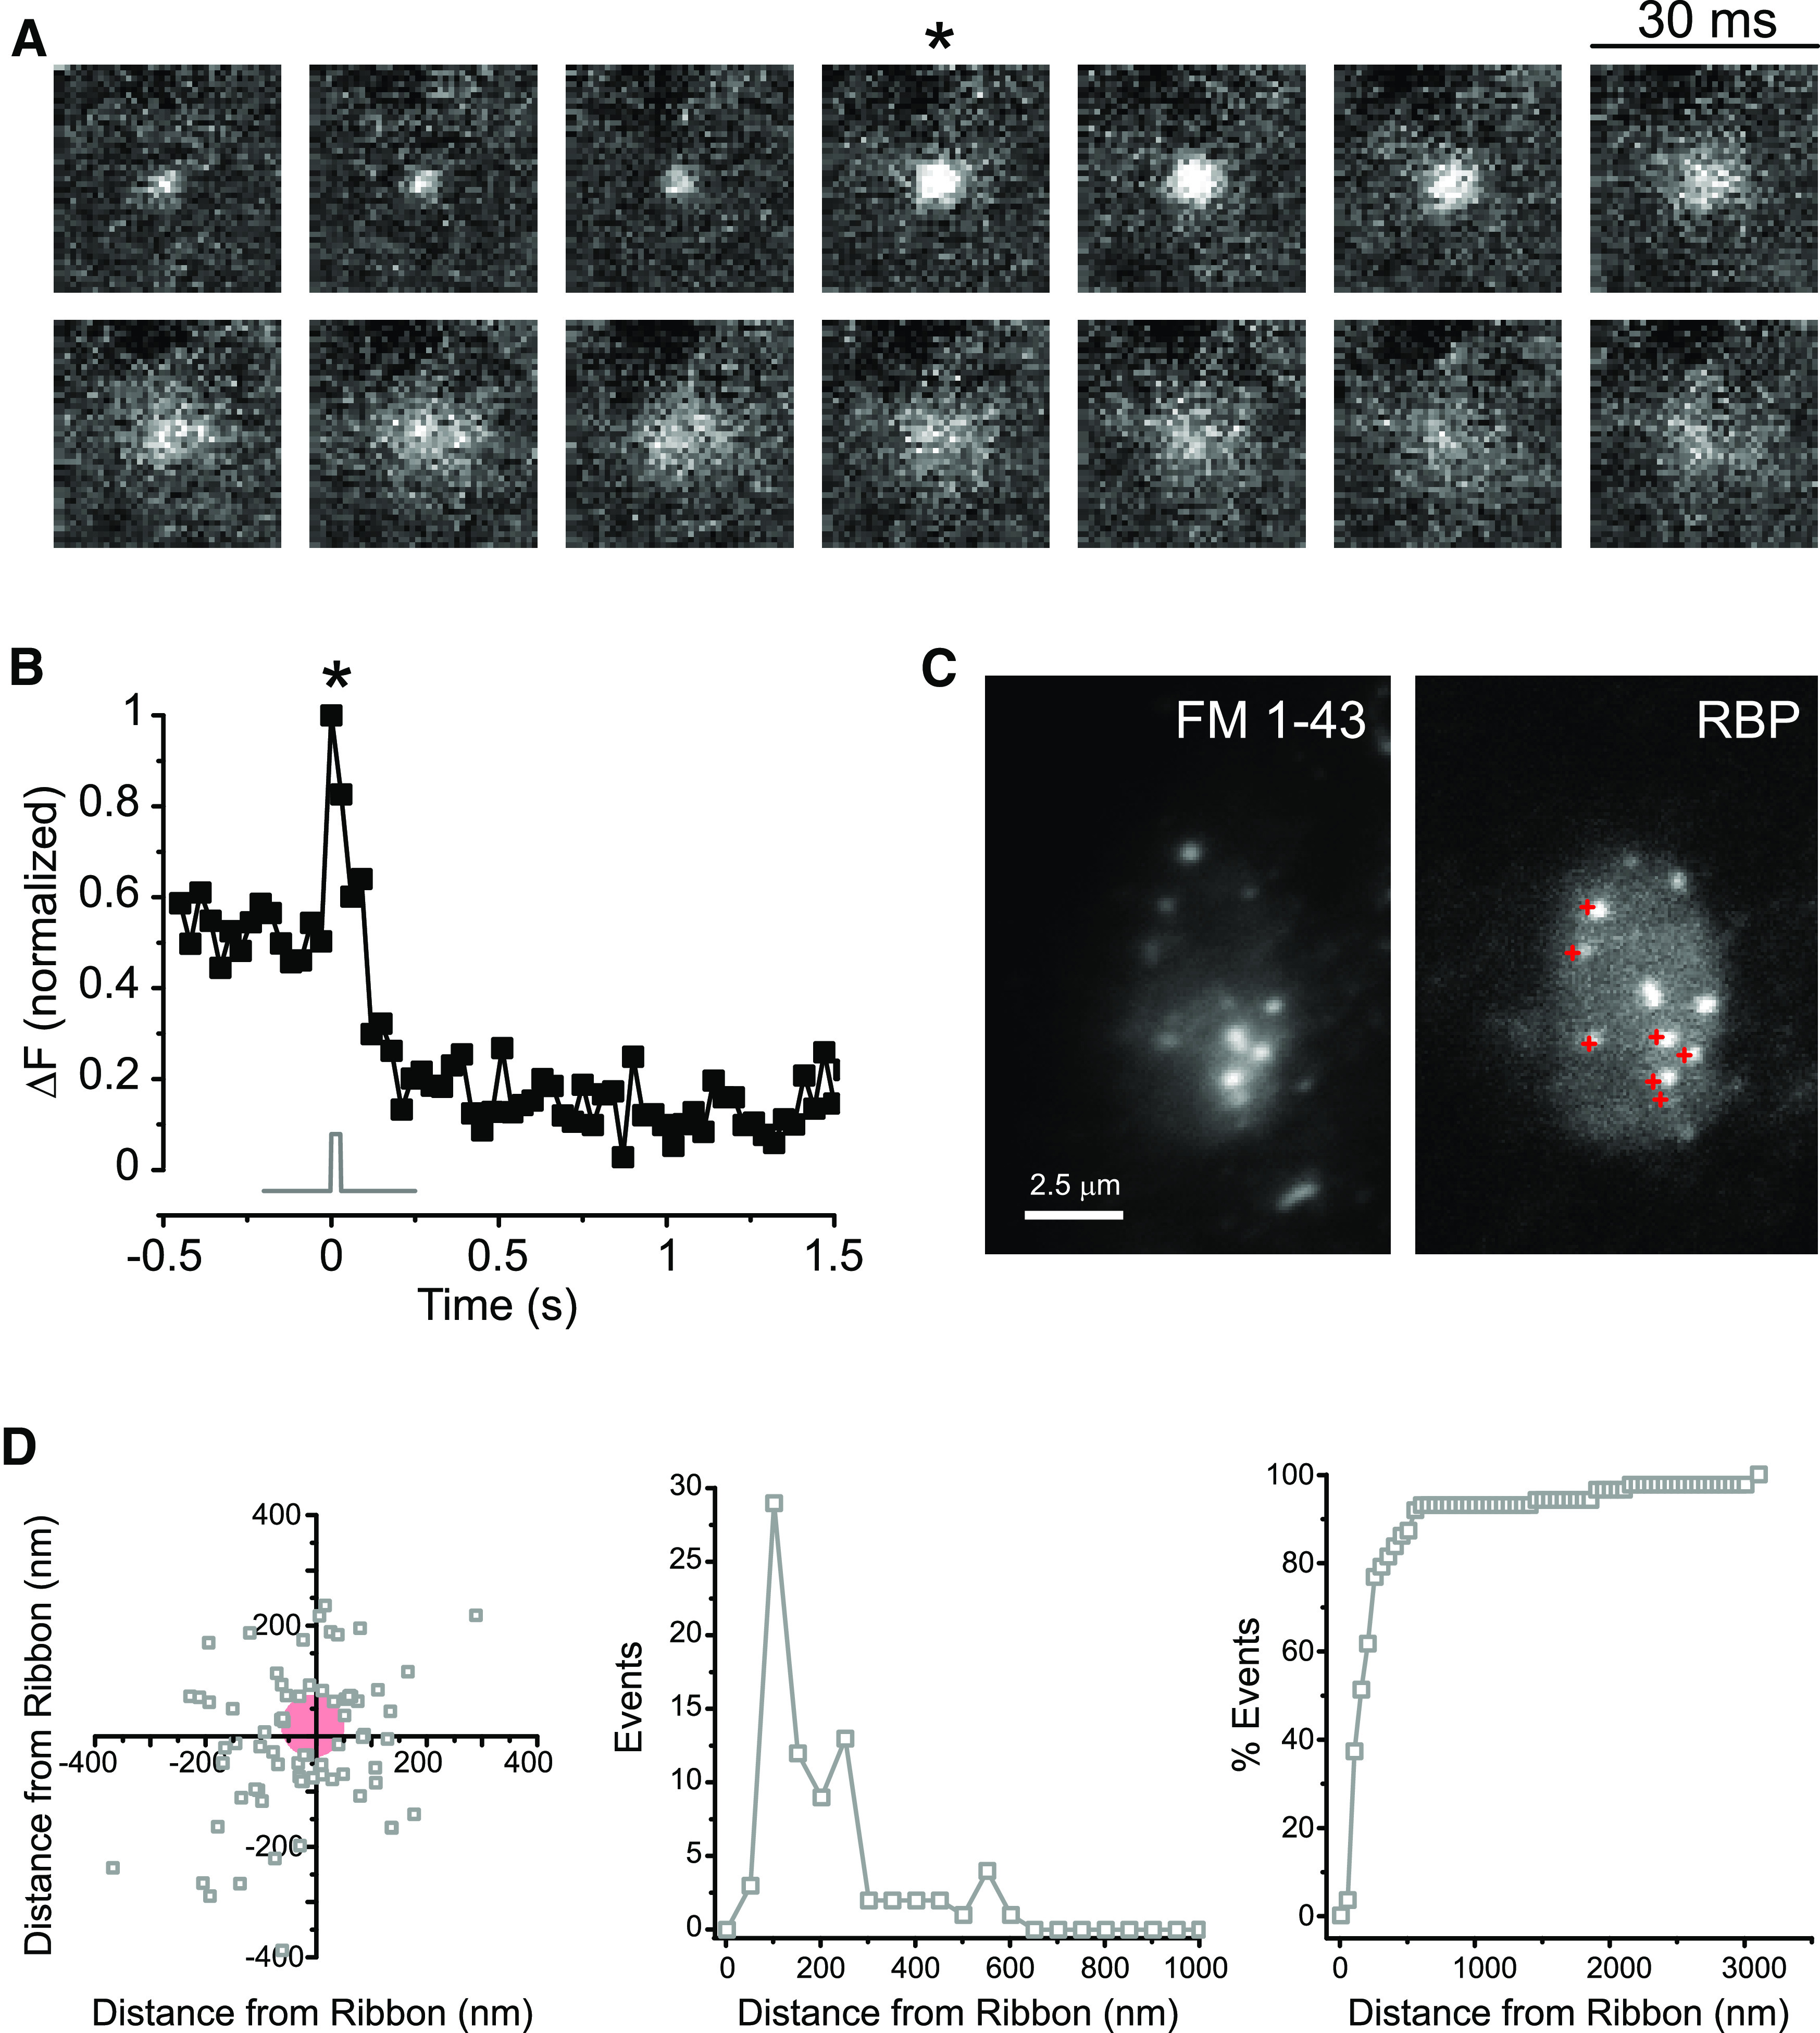
Released vesicles concentrate at ribbon sites. A, Consecutive video images from a docked vesicle that underwent fusion. Released vesicles appear as a cloud of dye and may be visible at the cell membrane for a long period of time. *The frame of a single 30 ms depolarization from −60 to 0 mV. B, The normalized fluorescence of the vesicle in A is plotted in relation to the timing of the voltage stimulus (gray trace). The release of vesicular contents is seen as an increase in fluorescence and correlates well to the change in membrane potential. *The timing of depolarization in A. C, Release events in a bipolar cell terminal seen with FM1-43 (left) correlate well with ribbons labeled in the same terminal by the ribeye-binding peptide (RBP, right). Red crosses in the RBP image represent released vesicles. The FM image is an average of 85 frames, and the RBP image is an average of 10 frames. D, High-resolution scatter plot (left), simple histogram (middle), and cumulative histogram (right) of 87 events observed in 25 records from 9 bipolar cells, showing that most vesicles docked within 300 nm of labeled ribbons. These active release zones correspond roughly to the base of synaptic ribbons. Red circle represents region devoid of vesicles near the center of the ribbon.