Figure 2.

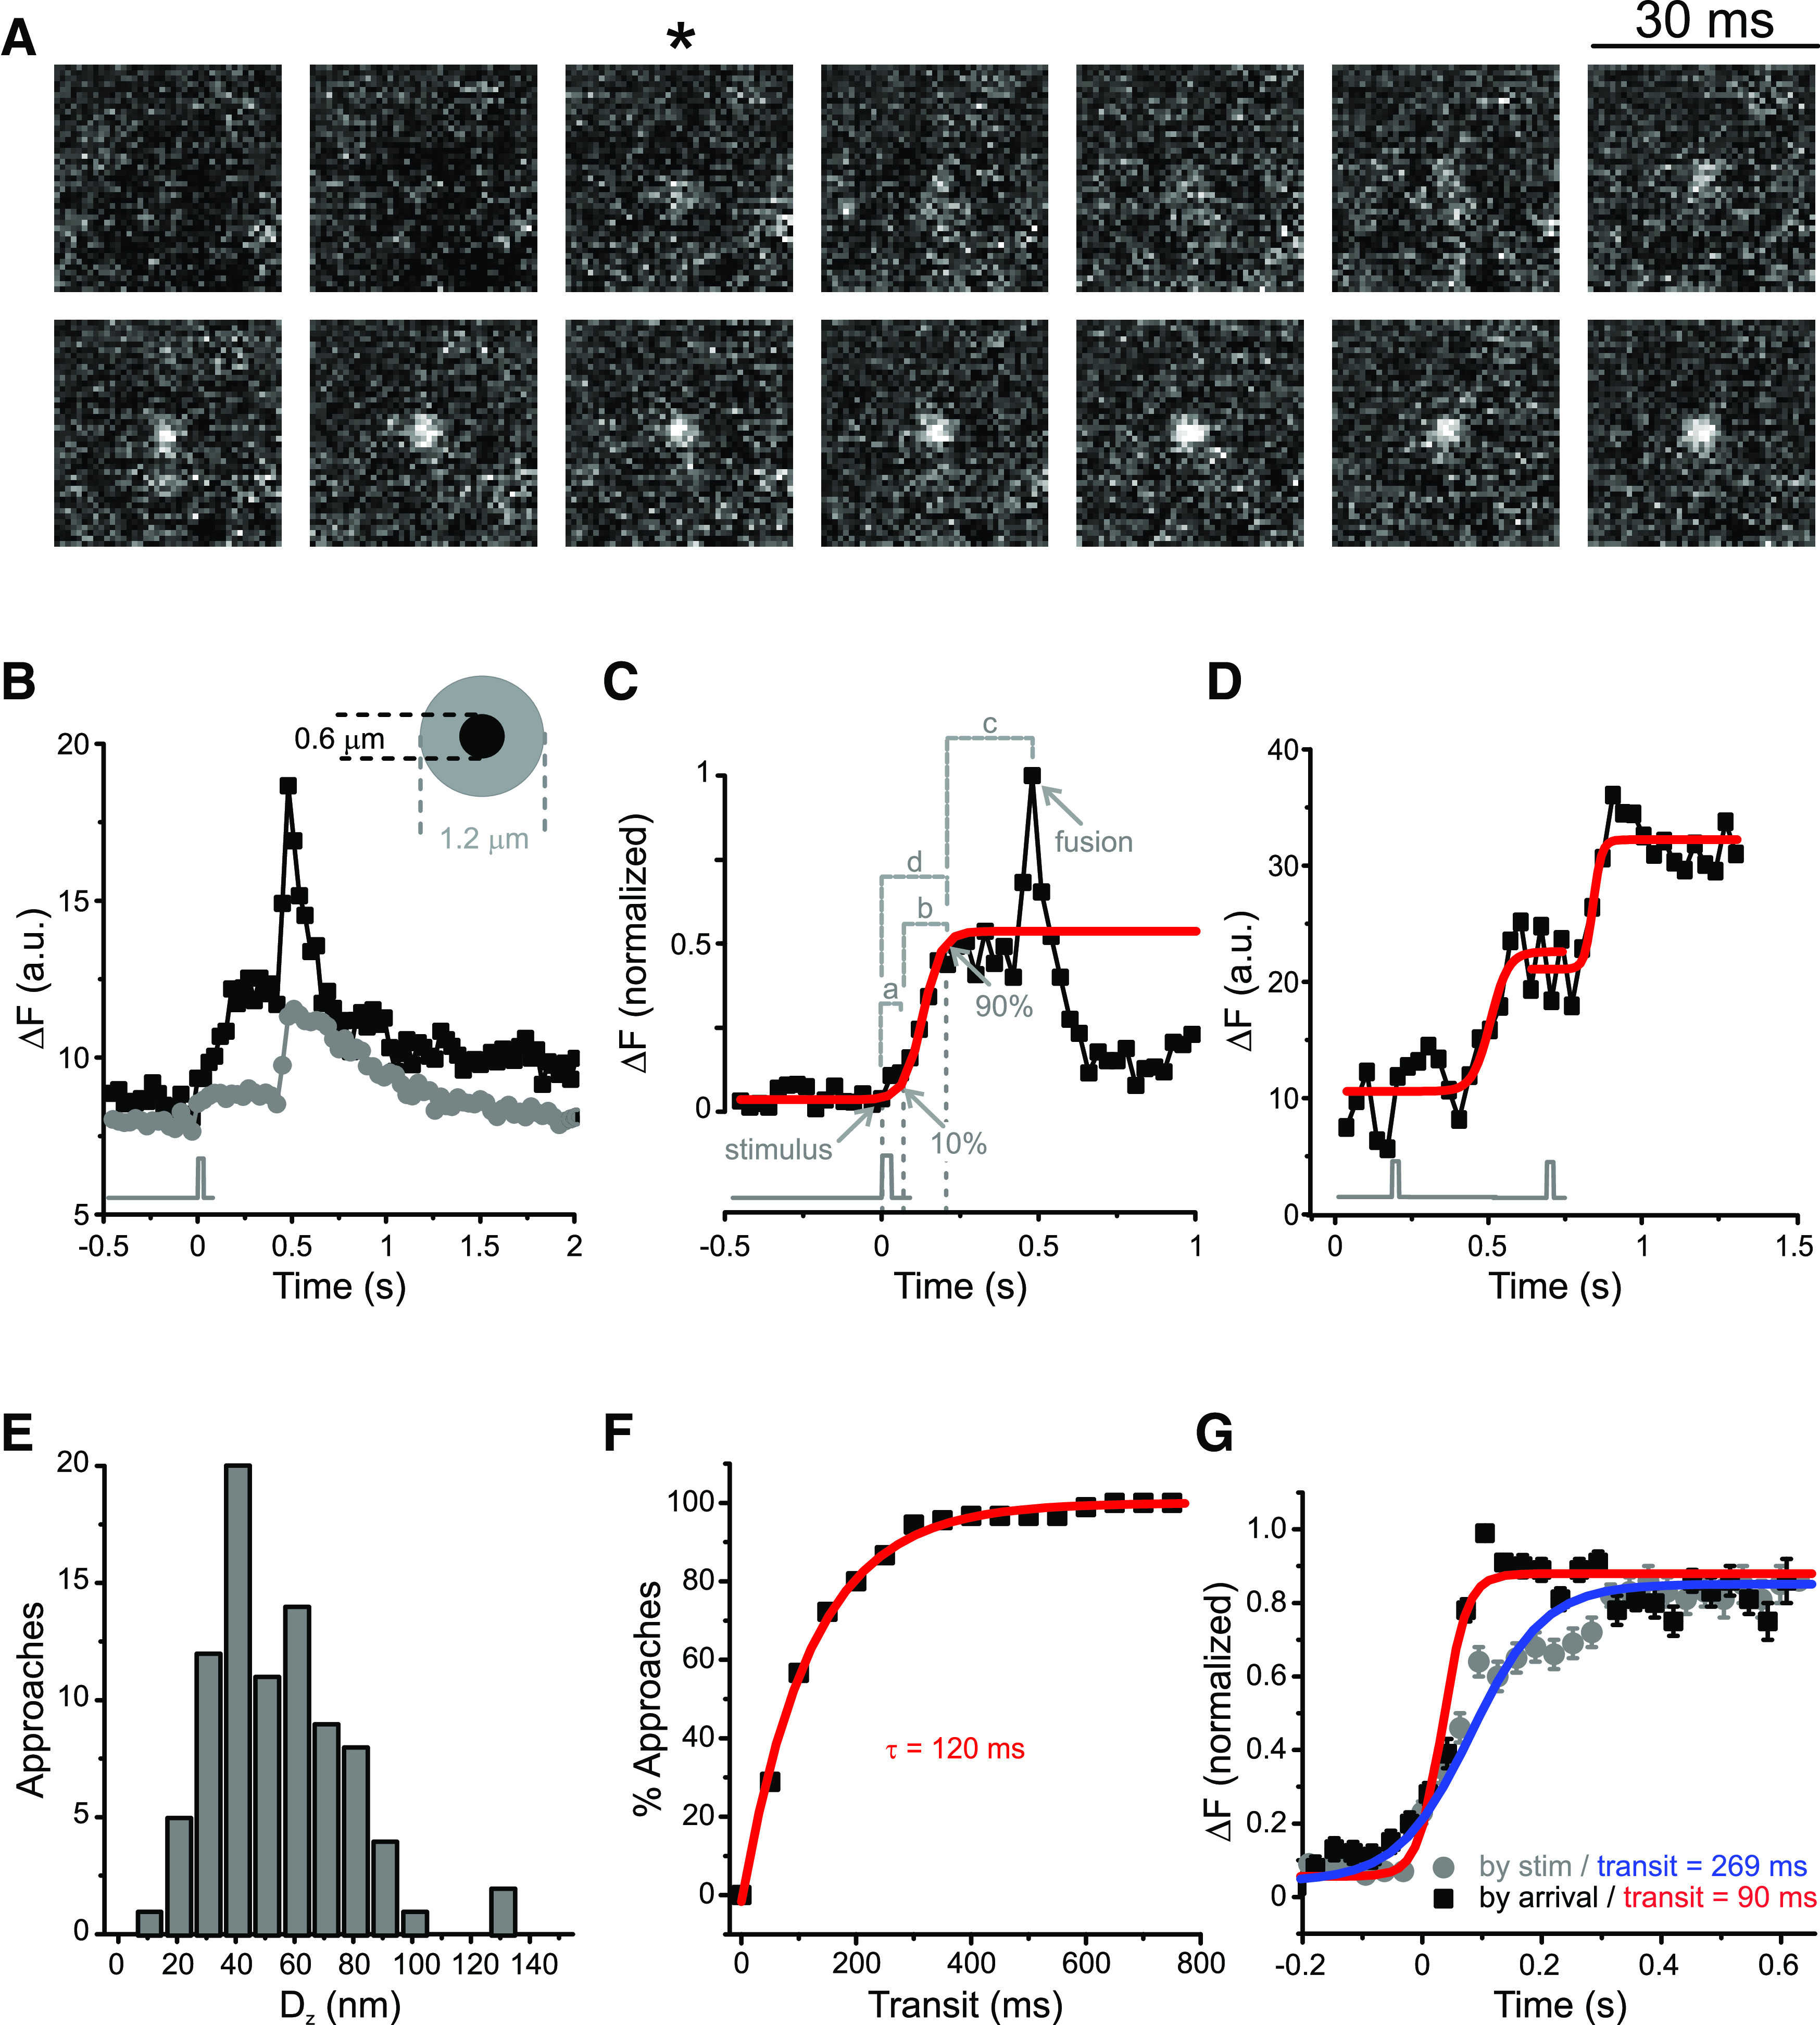
Vesicles move down the ribbon on stimulation. A, Voltage stimuli trigger capture and movement of vesicles move down the ribbon. Consecutive video images from a newly immobilized vesicle. *The frame of a single 30 ms depolarization from −60 to 0 mV. B, Quantifying triggered movement along the synaptic ribbon. Gray trace represents the timing of a single 30 ms depolarization from −60 to 0 mV. The fluorescence of a newly immobilized vesicle (black symbols) increases as the vesicle approaches the membrane, and this increase is strictly correlated with stimulus timing. The fluorescence is confined to a 0.6-µm-diameter circle (inset); the fluorescence of the surrounding area (gray symbols) does not increase in a similar fashion. C, The fluorescence profile of individual approaches (black squares) was fitted with a Boltzmann function (red trace), and the following parameters were measured for each vesicle: (a) delay for departure, defined as the difference between the estimated departure time (10% of the maximal amplitude of the Boltzmann function) and the stimulus time (gray trace under graph); (b) transit time, defined as the difference between the arrival time (90% of the maximal amplitude of the Boltzmann function) and the estimated departure time; (c) sitting time, defined as difference between the fusion time and the arrival time; and (d) delay for arrival, defined as the difference between the arrival time and the stimulus time. D, Example of a vesicle that makes two consecutive steps toward the membrane. Each step could be well fit by a Boltzmann function (red traces) with 127 and 61 ms transit times, respectively. Black trace represents stimulus timing. E, Triggered vertical displacement along the ribbon. Distance traveled by each of 94 approaches within a single step toward the membrane, calculated from the ratio of fluorescence between the start and end of the movement (see Materials and Methods). F, The cumulative distribution of transit times for 90 vesicle approaches can be described by an exponential function with time constant τ = 120 ms (red line, R2 = 0.99). G, Mean fluorescence profile of 92 approaches aligned to the arrival time (black squares) or to the stimulus time (gray circles). Boltzmann fits to these profiles (red and blue traces) yielded distinct transit times: 90 ms when vesicles were aligned to the arrival time and 269 ms when vesicles were aligned to the stimulus time. This means that vesicles can reach the membrane within 90 ms but start moving with a variable delay after the cell is depolarized. Error bars indicate SEM.
