
Figure 3.
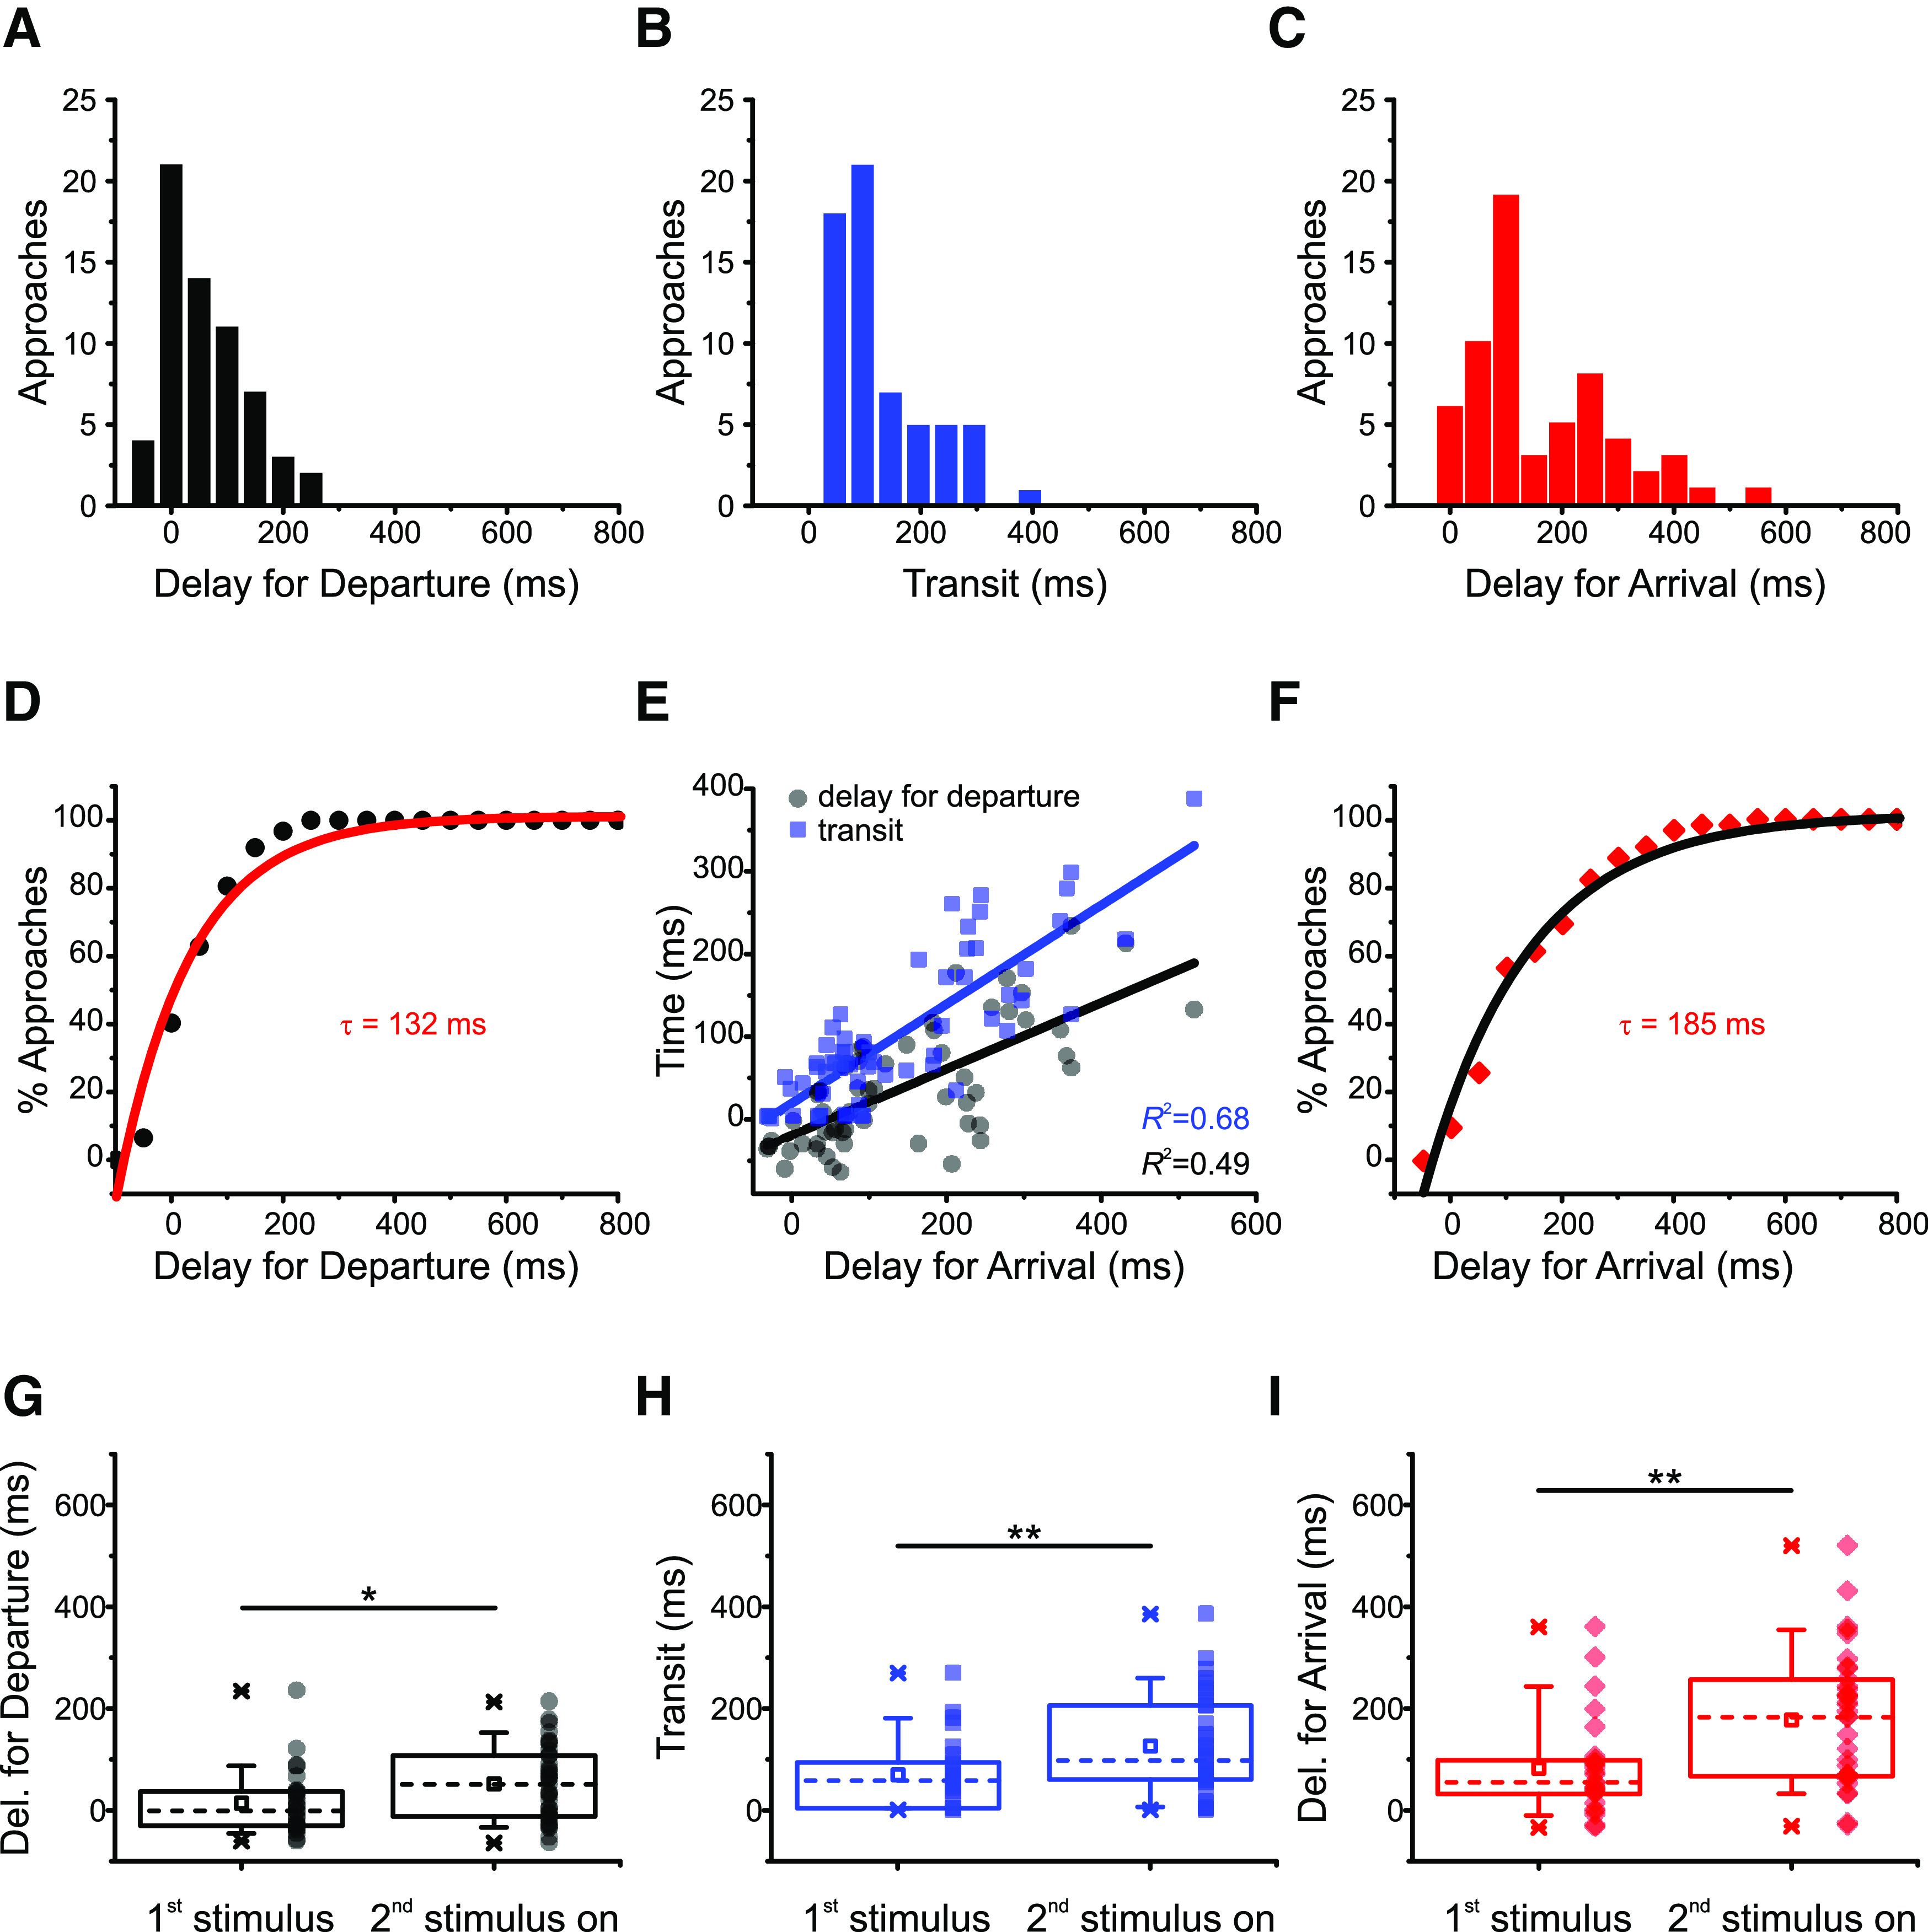
Arrival depends on how long vesicles travel and when vesicles depart. A, Distribution of delays for departure in 62 vesicle approaches (11 cells, 27 movies). The variability in delays for departure is larger than that of transit times (coefficient of variation = 1.99 for delays for departure 0.89 for transit times). B, Distribution of transits for the same vesicles in A; 74% of observed vesicles arrived at the membrane within 150 ms. C, Distribution of delays for arrival in the same vesicles of A and B. D, The cumulative distribution of delays for departure for the vesicle approaches in A can be described by an exponential function with time constant τ = 132 ms (red line, R2 = 0.96). E, Both transit times (black squares) and delays for departure (gray circles) contribute to delays for arrival. Straight lines indicate linear regressions to the data (R2 = 0.66 and R2 = 0.44, respectively). F, The cumulative distribution of delays for arrival for the vesicle approaches in C can be described by an exponential function with time constant τ = 185 ms (black line, R2 = 0.98). G, Delays for departure, (H) transit times, and (I) delays for arrival are influenced by stimulus history. Median values (indicated by the dashed lines) are smaller for the first stimulus compared with the remainder applied in all trains. Squares represent means. Boxes enclose the interquartile range (between the 25th and 75th percentiles). Bars represent the 10th and 90th percentiles. Stars represent the minimum and maximum. Significance: *p = 0.031 for delays for departure; **p = 0.009 for transit times; **p = 0.003 for delays for arrival; two-tailed Mann–Whitney test.