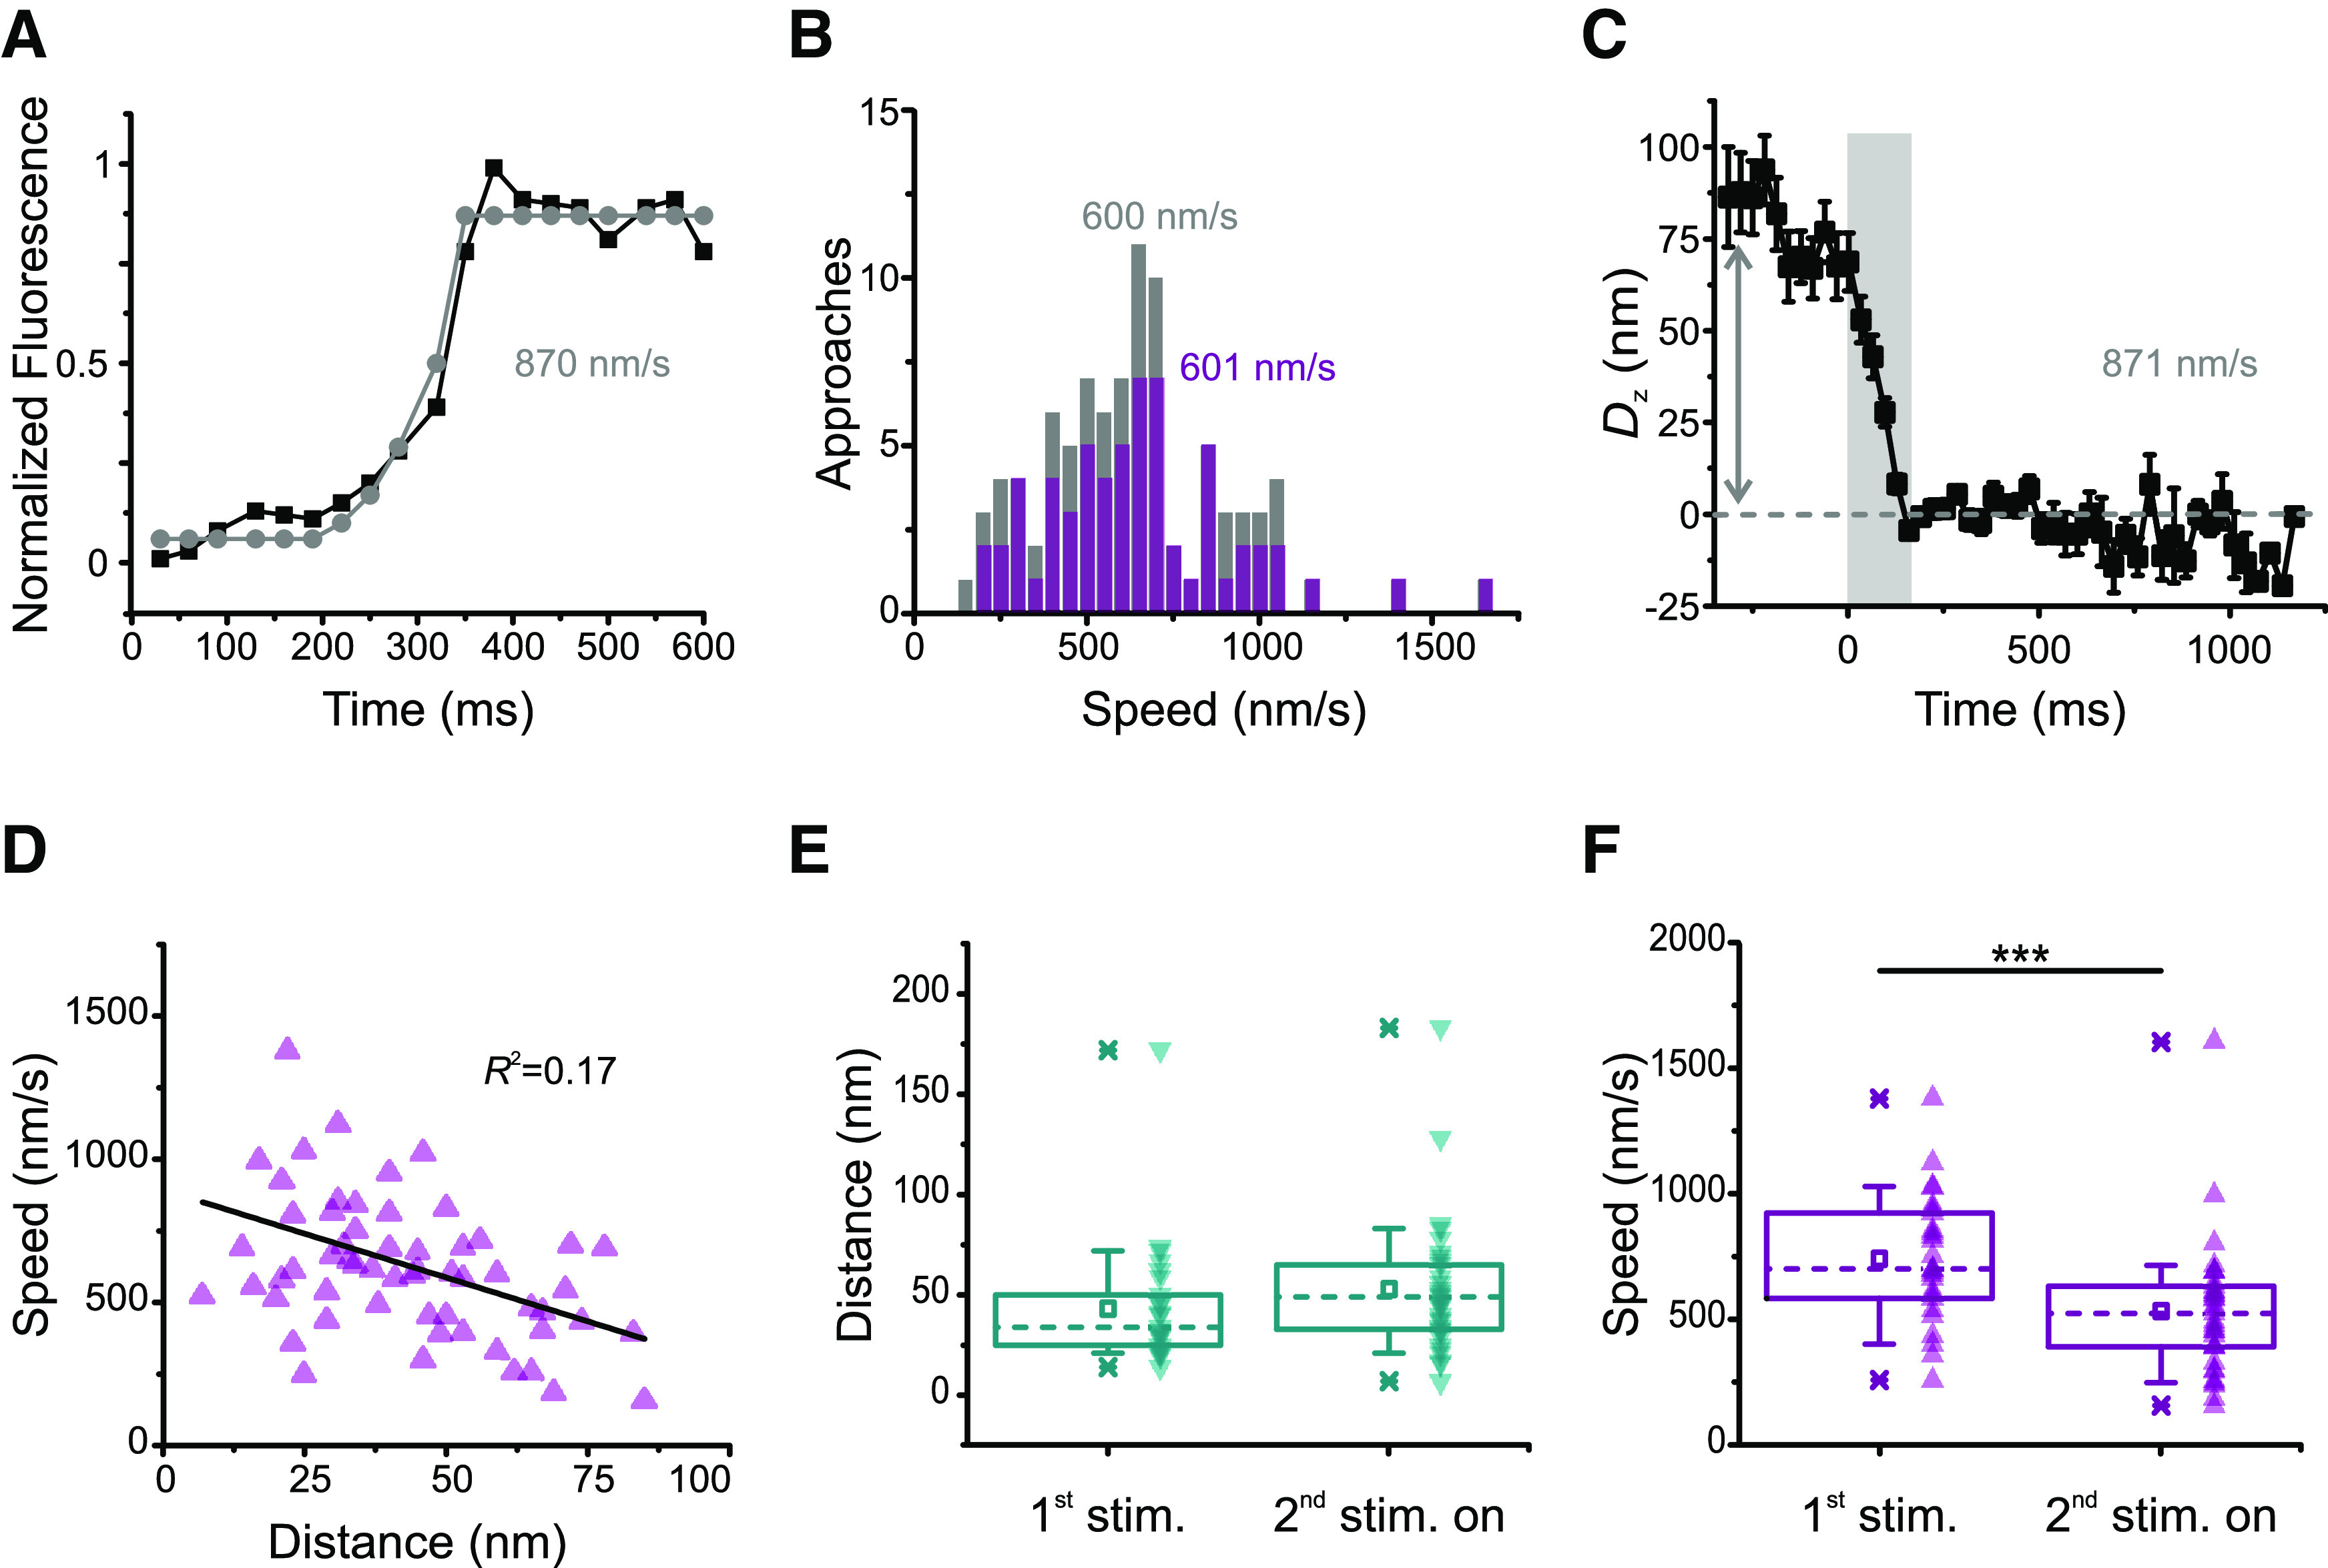
Figure 4.

Methods for estimating vesicle speed. A, The mean fluorescence profile of 92 approaches aligned to the arrival time (black squares, same as the black squares in Fig. 2G) was modeled with an exponential rise followed by an abrupt stop (gray circles), yielding a speed estimate of 870 nm/s. B, Distribution of the fluorescence of individual approaches fit with the model in A for n = 90 (gray, whole dataset, same as in Fig. 2E–G) or n = 62 (purple, same dataset as in Fig. 3). Average speeds were 608 ± 28 and 623 ± 35 nm/s, respectively (mean ± SEM). Medians depicted in the figure. C, Vertical displacement for the fluorescence of 92 approaches aligned to arrival time (black squares in Fig. 2G). Error bars indicate SEM. The mean total displacement was 78.46 nm (arrow); dividing this number by the mean transit for the dataset in Figure 2G (90 ms) yields a speed estimate of 871 nm/s. D, Vesicle speed does not correlate well with vertical displacement. Same dataset as in Figure 3 (n = 62 approaches, 27 movies, 11 cells). R2 depicted in the figure. E, There is no significant difference in distance traveled for first stimulus and subsequent stimuli. Although median (dashed lines) and mean (squares) speeds are larger from the second stimulus on, the difference is not statistically significant (U = 344.5, p = 0.069, two-tailed Mann–Whitney test). Boxes enclose the interquartile range (between the 25th and 75th percentiles). Bars represent the 10th and 90th percentiles. Stars represent minimum and maximum. F, Stimulus history influences speed. Both medians (dashed lines) and means (squares) are smaller from the second stimulus on. Boxes enclose the interquartile range (between the 25th and 75th percentiles). Bars represent the 10th and 90th percentiles. Stars represent minimum and maximum. ***Significance (U = 718, p = 0.00036, two-tailed Mann–Whitney test).
