Figure 5.
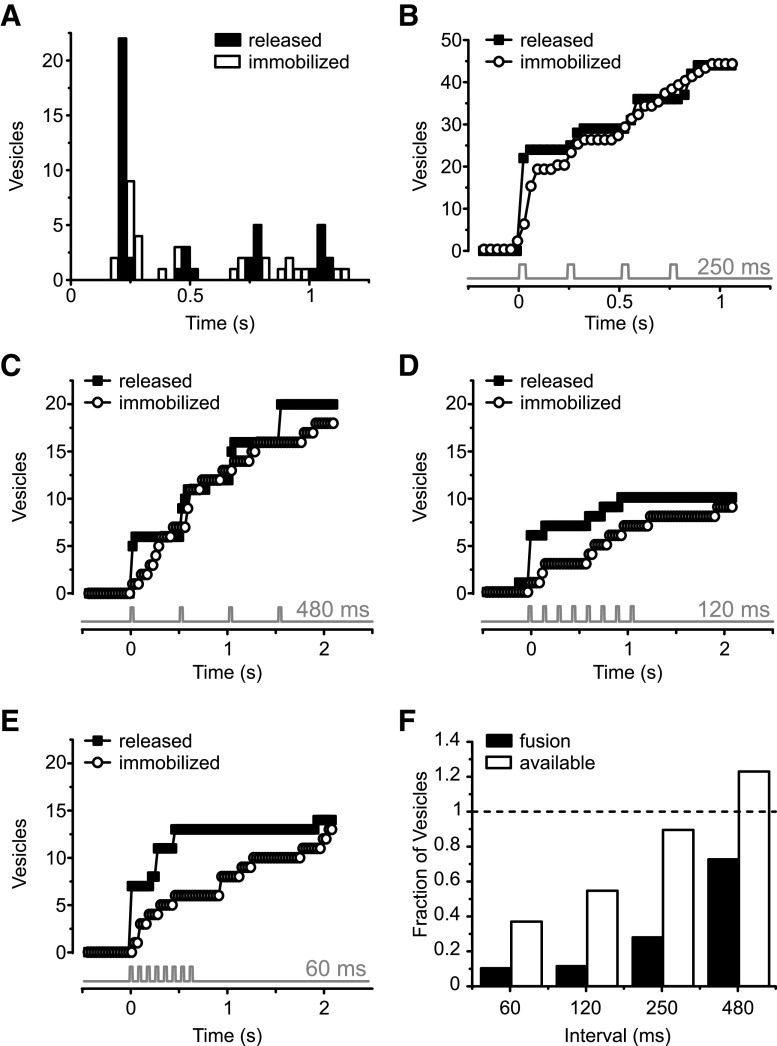
Timing of vesicle exocytosis and translocation in response to train of stimuli. A, Histogram showing timing of fusion events (black columns) and capture events (white columns) in response to series of four 30 ms depolarizations from −60 to 0 mV at 4 Hz. B, Bottom, Timing of depolarizations. Data from 4 cells, 19 movies. Cumulative histogram of the data in A. Black squares represent fusion events. White circles represent captured vesicles. Gray trace represents the timing of each voltage step. During the trains, the total number of newly recruited vesicles follows closely the number of released vesicles. C, Cumulative histogram of fusion events (black squares) and capture events (white circles) for the protocol with 480 ms interstimulus interval (n = 5 cells, 6 movies). Also, here the number of immobilized vesicles follows closely the number of released vesicles. D, Cumulative histogram of fusion events (black squares) and capture events (white squares) for the protocol with 120 ms interstimulus interval (n = 5 cells, 5 movies). For this protocol, the number of immobilized vesicles falls short of the number of released vesicles at all times during the voltage train but catches up by the end of the movie. E, Cumulative histogram of fusion events (black squares) and capture events (white squares) for the protocol with 60 ms interstimulus interval (n = 4 cells, 5 movies). Here, vesicle depletion is most pronounced. F, Fractional vesicle occupancy and fusion events for all depolarizations after the first one in a train, normalized to the number of fusion events in the first depolarization. The occupancy at each depolarization (available) was estimated by taking the number of newcomer vesicles and subtracting the number of vesicles lost by exocytosis. Replenishment maintains an available pool of vesicles for longer intervals but fails to fully replenish vesicles following shorter intervals (white bars).

