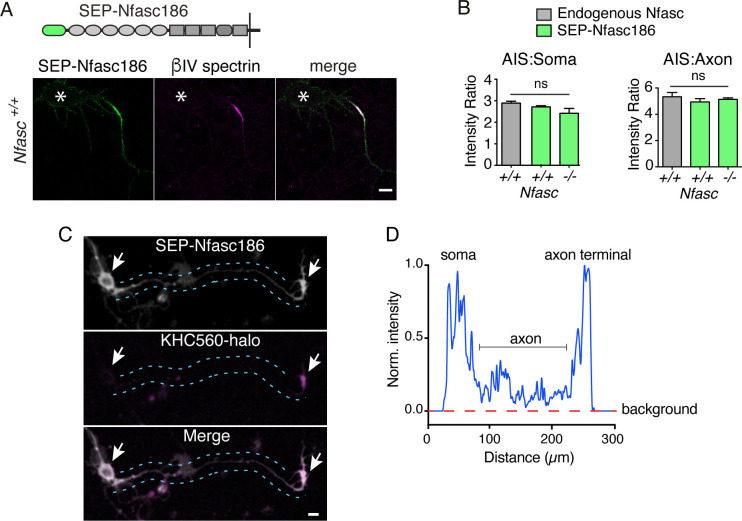
Figure 1. SEP-Nfasc186 accumulates at the AIS and the cell surface of the soma and axon terminus before the formation of the AIS.
(A) Immunostaining of cortical neurons at DIV 7 shows that SEP-Nfasc186 is delivered to the AIS where it colocalises with ßIV-Spectrin. Location of the cell body is shown by asterisks. Scale bar, 10 µm. (B) Quantitation of signal intensity shows comparable enrichment of SEP-Nfasc186 relative to either the soma or distal axon when compared to endogenous Neurofascin irrespective of expression in WT or Neurofascin-null neurons. n = 3, ≥41 cells; one-way ANOVA; ns = not significant. (C) Live imaging before AIS formation at DIV 3 shows SEP-Nfasc186 at the surface of the soma and axon terminus (arrows). KHC560-halo identifies the axon terminus. Dashed lines outline the axon. Scale bar, 10 µm. (D) Line scan of top panel in (C) showing the SEP-Nfasc186 signal intensity in the cell body, axon and terminal relative to background.


