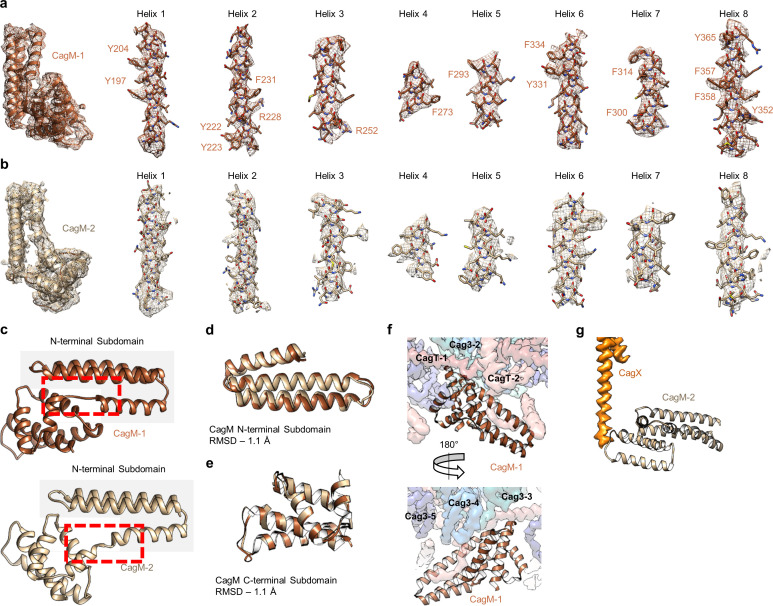
Figure 7. Localization of CagM within the I-layer of the OMC.
(a) We modeled a single domain of CagM-1, consisting of 8 helices within the I-layer of the OMC. Representative density for all eight helices is shown with landmark residues indicated. (b) Although the local resolution within the I-layer is notably lower than that of the O-layer, several structural features within the I-layer density are consistent with the sequence of CagM (designated CagM-1). The correlation of all 8 helices of CagM-2 to the experimental map is shown. (c) The two subdomains within CagM are connected by a hinge (noted by the red dotted line). When the CagM-1 subdomains are aligned independently, we note RMSDs of 1.1 Å for both the N-terminal subdomain (d) and the C-terminal domain (e). The differences in sub-domain orientation are likely the result of differences in interacting partners of CagM-1 (f) and CagM-2 (g) within the OMC.

