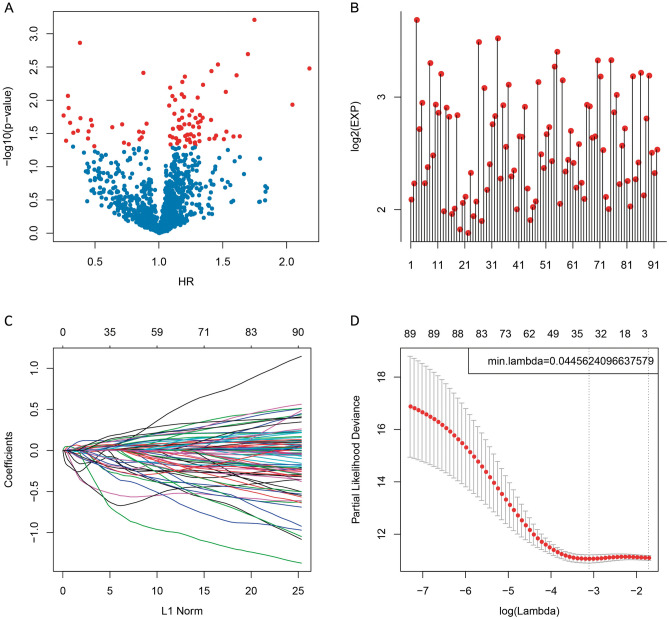
Figure 1.
Construction of the prognosis prediction model for glioblastoma (GBM) patients by least absolute shrinkage and selection operator (LASSO) analysis. (A) The relationships between the p values of 92 genes and the hazard ratio (HR). (B) The relationships between the p values of 92 genes and the expression levels. Red dots represent significantly different immune-related genes regarding prognosis. (C) The changing trajectory of each independent variable. The horizontal axis represents the log value of the independent variable lambda, and the vertical axis represents the coefficient of the independent variable. With the increase in lambda, the number of independent variable coefficients tending to 0 also increases. (D) Confidence intervals for each lambda. The optimal model is acquired when the lambda is 0.04456.

