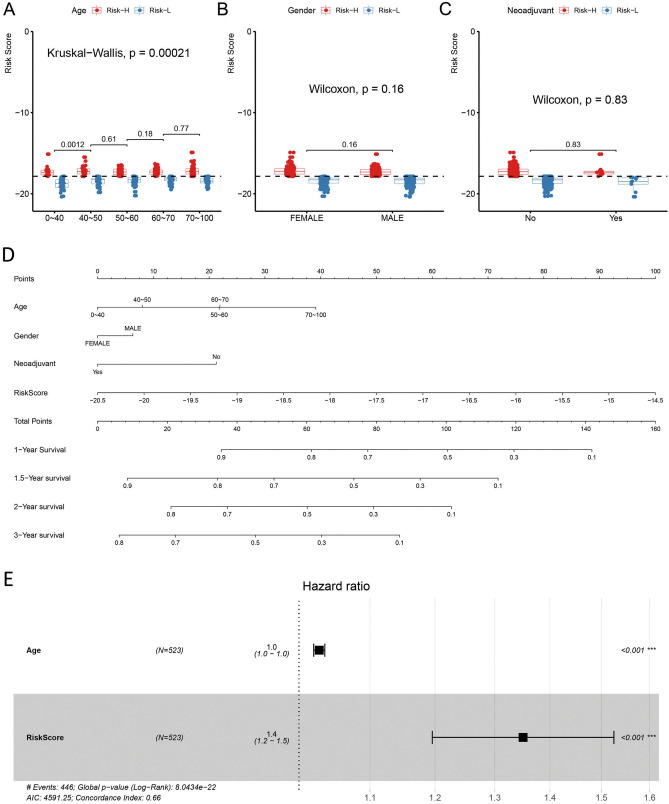
Figure 5.
The relationships of different clinical factors with RiskScore values of GBM patients. Comparison of RiskScore among different ages (A), sexes (B), and neoadjuvants (C). The horizontal axis represents the different clinical factors, and the vertical axis represents RiskScore values. The constructed RiskScore model was dependent on patient age. (D) The nomogram model constructed by combining the clinical features (age, sex, neoadjuvant) with the RiskScore of GBM patients. There was an obvious association with the greatest influence on predicting the survival rate. (E) The forest plot constructed by combining age with RiskScore for GBM patients. The HR for RiskScore was approximately 1.4 in the forest plots established in combination with RiskScore and age (p < 0.05).

