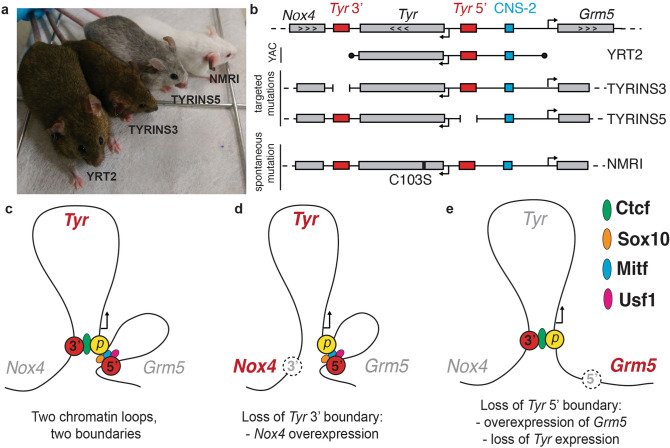
Figure 6.
Model of the Tyr locus. (a) Representative individuals of mouse models for the Tyr locus: YRT2, TYRINS3, TYRINS5 and albino NMRI, along with (b) schematics of their genomic modifications. (c) When transcriptionally active, the Tyr locus is organized in two loops, mediated by CTCF at the 3′ boundary and likely by Sox10, Mitf and Usf1 binding at the 5′ boundary. (d) Inactivation of the Tyr 3′ boundary results in ectopic expression of Nox4, the gene located beyond the boundary. (e) Inactivation of the Tyr 5′ boundary causes loss of Tyr expression and overexpression of Grm5, past the boundary. Figure prepared with Adobe Illustrator. The image included in this figure has been obtained by Davide Seruggia at the CNB-CSIC in Madrid under the supervision of Lluis Montoliu.

