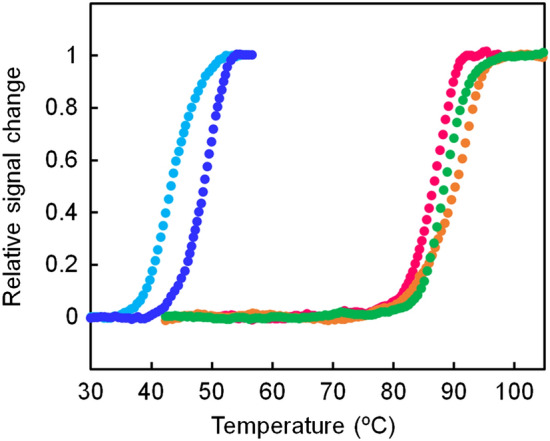
Figure 4.

Thermal melting curves of the ancestral and extant IPMDHs. The change in ellipticity at 222 nm was monitored as a function of temperature. The scan rate was 1.0 °C/min. The samples comprised 5.0 μM protein in 20 mM potassium phosphate (pH 7.6), 0.5 mM EDTA. Each experiment was conducted in duplicate with identical melting profiles within experimental error. The plots were normalized with respect to the baseline of the native and denatured states. Green, ancIPMDH-IQ; orange, ancIPMDH-ML; magenta, T. thermophilus PMDH; blue, B. subtilis IPMDH; cyan, S. cerevisiae IPMDH.
