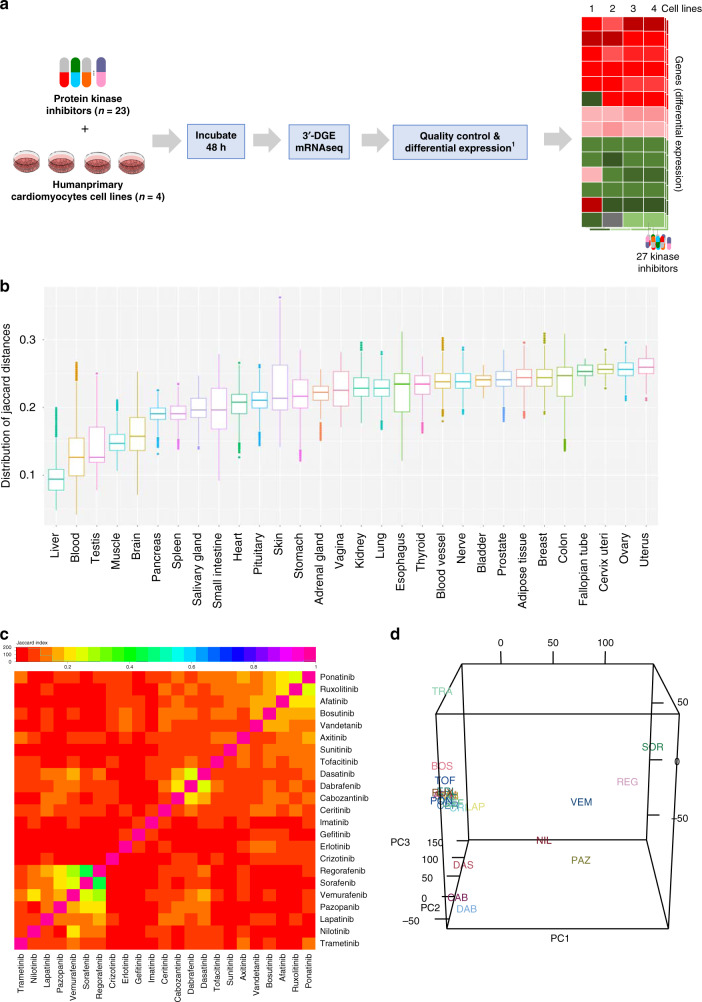
Fig. 2. Overview of pan-KI transcriptomic profiling in human primary cardiomyocyte-like cells.
a Overview of experimental approach to generate transcriptomic data. For each drug, genes were ranked by absolute mean fold-change gene-expression value across replicates (>3 biological replicates) and cell lines (a total of 1309 experiments), and the top 250 genes for each KI were kept. Information about the total number of replicates can be found in the source data file. b Jaccard similarity of gene-expression signature of PromoCell cardiomyocyte cell lines (102 samples) to gene-expression signatures of tissues available in the GTeX database (17,382 total samples). Boxplot whiskers refer to the upper and lower quartile of all pairwise Jaccard coefficients between each sample, within each tissue type. Information about each boxplot’s sample size, minima, maxima, and center is provided in the source data file. c Heatmap depicting the Jaccard index that indicates the magnitude of similarity in top-ranking differentially expressed genes for all KI pairs. d First three principal components (PCs) based on full mean fold-change gene-expression profiles across KIs. Source data are provided in source data file.

