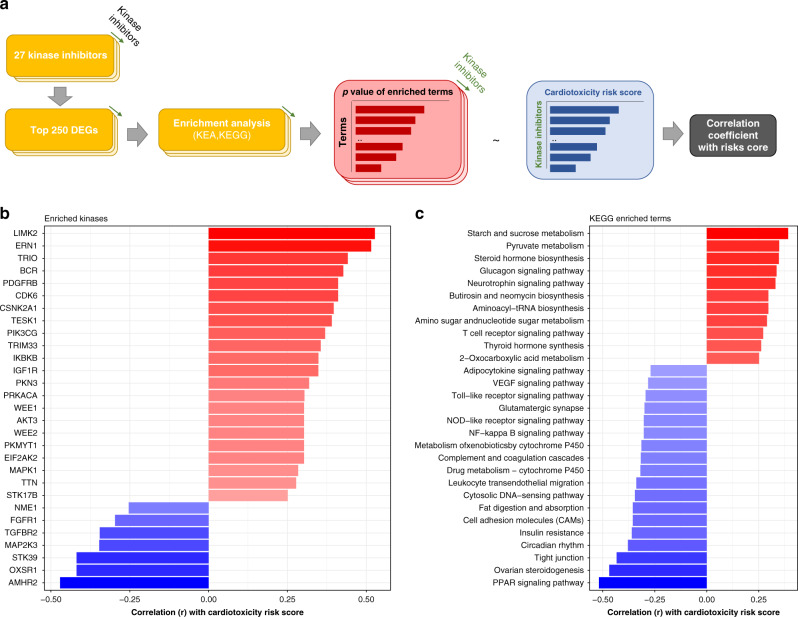
Fig. 3. Analysis of transcriptomic profiling data in relation to cardiotoxicity risk.
a Flowchart indicating ranked lists of top 250 differentially expressed genes ranked by p value for each kinase inhibitor across cell lines from the transcriptomic cardiomyocyte profiling, which were then enriched and subsequently related to clinical cardiotoxicity risk scores. Enriched kinases (b) and enriched KEGG pathways (c) (p < 0.05) that show a correlation coefficient > |0.25| with cardiotoxicity risk scores and the associated enrichment p values. Source data are provided in source data file.

