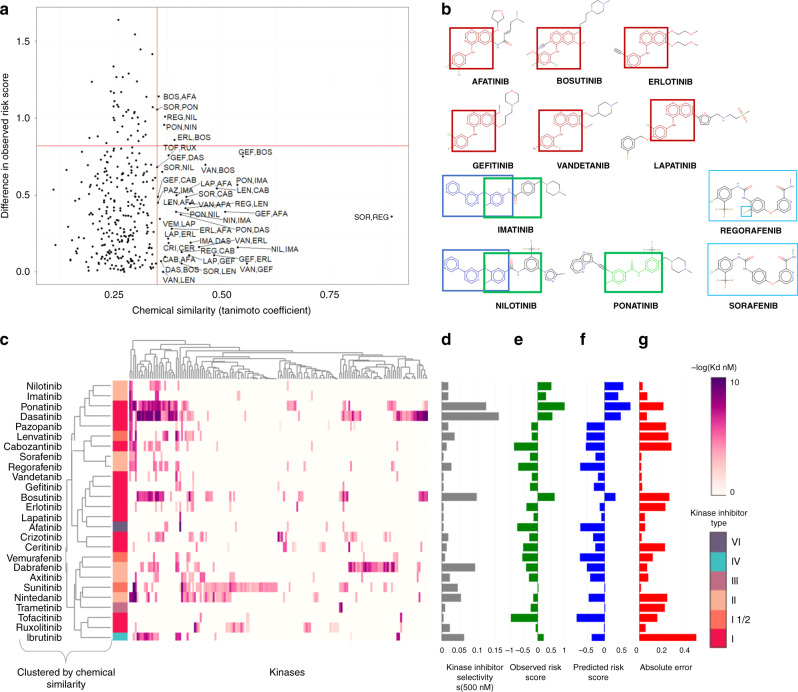
Fig. 5. Structure–activity–similarity (SAS) maps of kinase inhibitor activity and cardiotoxicity.
a A SAS map relating pairwise chemical similarity measured by Tanimoto coefficient (Tc) derived from a weighted average of 4 chemical fingerprints (ECFP4, ECFP2, Daylight, and MACCS), between pairs of 26 kinase inhibitors (Table 1) and their difference in cardiotoxicity scores (DCS). The threshold for chemical similarity was the top 10% value in the distribution of Tc values: 0.38. The threshold value for DCS was half of the maximum DCS score: 0.82. b Highlighted chemical scaffolds for distinct kinase inhibitors observed in the upper- and lower-right regions. c Binding profile of kinase inhibitors based on data from Klaeger et al.5. Kinase inhibitors were hierarchically clustered based on chemical similarity, and kinase inhibitors are annotated by their binding mode (e.g., type I, type I1/2, type II, type III, type IV, or type VI)6. d Kinase inhibitor selectivity scores at 500 nM Kd. e Observed cardiotoxicity risk scores were normalized to zero and ordered based on hierarchical clustering of the kinase inhibitors. f Predicted cardiotoxicity risk scores were normalized to zero and ordered based on hierarchical clustering of the kinase inhibitors. g Absolute error from observed and predicted cardiotoxicity risk scores. Source data are provided in source data file.

