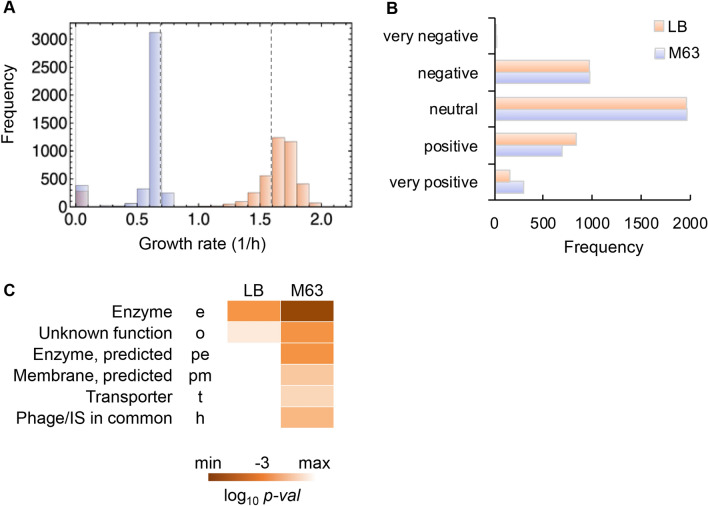
Figure 1.
Growth rates of the single-gene knockout strains. (A) Distributions of the growth rates. Exponential growth rates of the single-gene knockout strains (N = 3,909) grown in LB and M63 media are shown in peach and lilac, respectively. The growth rates of the wild-type strain BW25113 in both media are indicated with broken lines. (B) Gene classification based on the growth rate. According to the box-and-whisker plot (Fig. S1), five gene classes were newly defined in the growth conditions in LB and M63 media, which are shown in peach and lilac, respectively. Very negative, negative, neutral, positive, and very positive indicate the growth rates of the single-gene knockout strains within the ranges of the outliers greater than the 1.5 interquartile range (IQR), from the 1.5 IQR to the upper quartile, from the upper to the lower quartiles, from the lower quartile to the 1.5 IQR, and within the ranges of outliers lower than 1.5 IQR, respectively. (C) Heatmap of the enriched gene categories for the very positive class. The gradation from light to dark orange indicates the statistical significance of the enrichment analysis from low to high, respectively.

