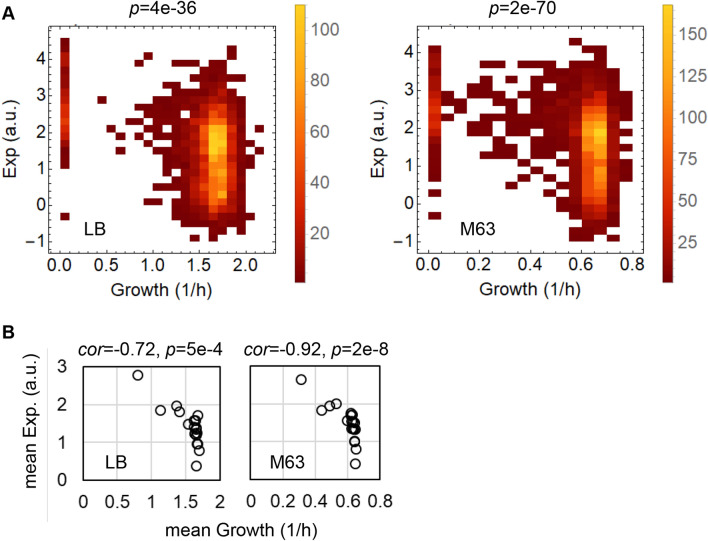
Figure 2.
Correlation between growth and expression. (A) Density histograms of the growth rates and gene expression. The left and right panels represent the relationships between the expression levels of the genes in the wild-type strain and the growth rates of the knockout strains lacking the corresponding genes in LB and M63 growth conditions, respectively. The colour gradation from red to yellow indicates the number of genes/strains from small to large, respectively. The correlation coefficients are − 0.37 and − 0.39 for LB and M63, respectively. The statistical significance of the Spearman correlation is indicated. (B) Scatter plots of the mean growth rates versus the mean expression levels of the gene categories. The open circles represent a total of 19 gene categories, which comprised more than 30 genes. The correlation coefficients and statistical significance are indicated.

