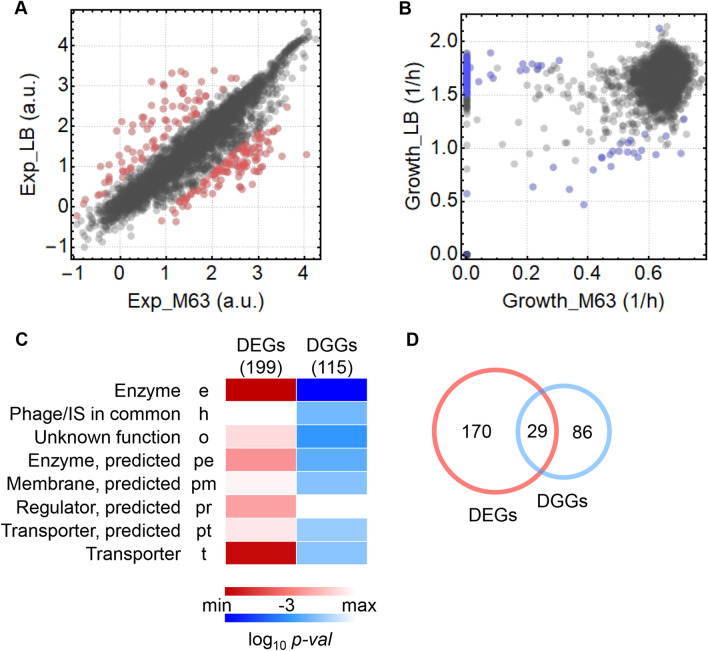
Figure 3.
Genes with differential expression and growth in response to media changes. (A) Scatter plot of the gene expression of the wild-type strain. Exp_LB and Exp_M63 indicate the expression levels (log10RPKM) in LB and M63, respectively. The DEGs in response to media changes are highlighted in red. (B) Scatter plot of the growth rates of the single-gene knockout strains. Growth_LB and Growth_M63 indicate the growth rates of the single-gene knockout strains grown in LB and M63, respectively. The strains showing differential growth rates (DGGs) are highlighted in blue. (C) Heatmap of the enriched gene categories of DEGs and DGGs. The gradation from light to dark red and blue indicates the statistical significance of the enrichment analysis from low to high for the DEGs and DGGs, respectively. (D) Venn diagram of DEGs and DGGs. The numbers of the genes specifically and commonly determined as DEGs and DGGs are indicated.

