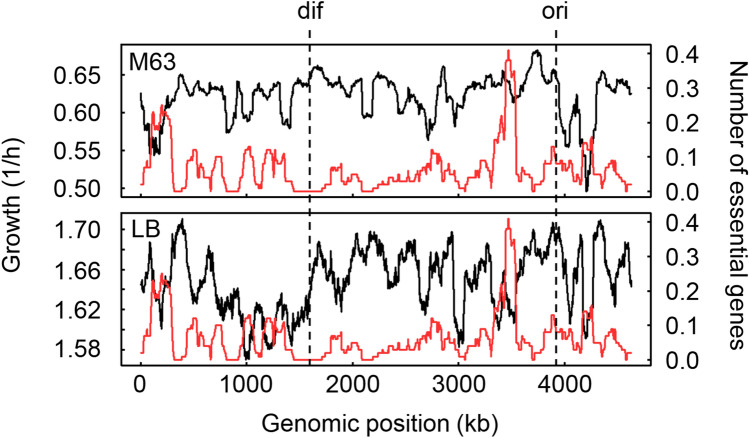
Figure 4.
Genomic distributions of the growth rates of the knockout strains. The growth rates of the knockout strains are plotted against the genome of the wild-type genome BW25113 at the genomic positions of the knockout genes, which are the nonessential genes. The mean growth rates of the knockout strains lacking the corresponding genes in every 1kb sliding window are shown in 100-kb bins by the black curves. The genomic distribution of the essential genes is shown by the red curves. The mean numbers of essential genes in every 1kb sliding window are shown in 100-kb bins. The ori and dif are indicated with broken lines. The upper and bottom panels represent the growth in M63 and LB media, respectively. The Pearson correlation coefficients between the mean growth rates and the mean numbers of essential genes were -0.03 (p = 0.06) and − 0.15 (p = 3e − 24) in M63 and LB, respectively.

