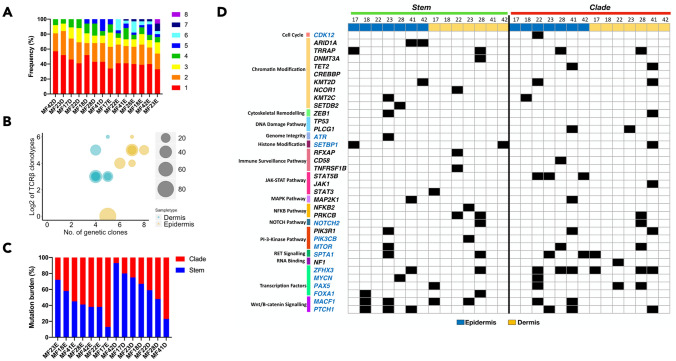
Figure 3.
Evolutionary facets of the genetic clones in the skin microenvironment. Combined data from SVs and CNA for each sample was subjected to phylogenetic analysis to identify genetic subclones. (A) Rainbow graph representing the number and proportion of the subclones identified in each sample. (B) Bubble plot representing the correlation between the TCRβ clonotypes and the genetic subclones. The number of TCRβ clonotypes are represented as Log2 scale. (C) Phylogenetic trees are composed of stem and clades (also recognized as branches). Bar graph represents the percentage of all mutations in each section (stem and clade) of the phylogenetic tree. The blue and red colour represents the mutations in stem and clades respectively (D) Mutational landscape of the putative driver genes in the different sections of the phylogenetic tree for two layers of skin (epidermis and dermis). Function significance of the mutations include missense, frameshift, insertions, deletions, stop gain or loss and variant in 3′ and 5′ UTR. No colour indicates absence of mutation in the sample.

