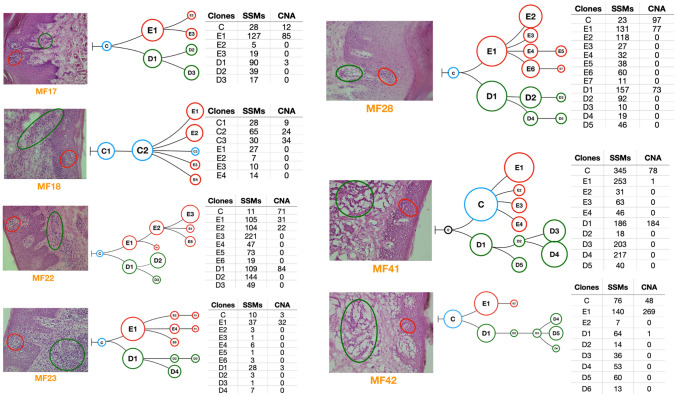
Figure 4.
Phylogenetic analysis of the neoplastic T-cells in skin microenvironment. Genetic abnormalities (SVs and CNA) for neoplastic cells microdissected from epidermis and dermis were subjected to phylogenetic analysis. Each phylogenetic tree represents an individual patient sample. The blue circles indicate the common clone between the two skin layers. Red and green indicate the subclones in epidermis and dermis respectively. Black circles indicate absence of the common ancestral clone. The tables adjacent to each figure provide the number of SVs and CNA identified in each of the subclones in the phylogenetic tree.

