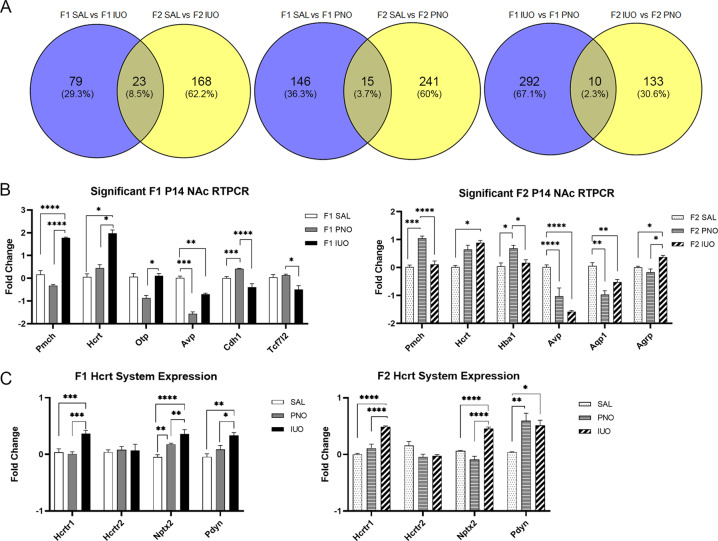
Fig. 3. RNA-seq analysis on P14 nucleus accumbens (NAc) of F1 and F2 animals.
a Venn diagram depicting the total number of genes affected in the comparison of treatment groups of each generation. b Of the genes post validated in the F1 NAc samples, Pmch, Hcrt, Otp, Avp, Cdh1, Oxt, and Tcf7l2 were significant. Of the genes post validated in the F2 NAc samples, Pmch, Hcrt, Hba1, Avp, Aqp1, and Agrp were significant. *p < 0.05; **p < 0.01; ***p < 0.001; ****p < 0.0001 as determined by one-way ANOVA followed by a post hoc Tukey’s test. c Further investigation of the hypocretin system neuropeptide expression levels found Hcrtr1, Nptx2, and Pdyn were upregulated in the IUO group of both generations. *p < 0.05; **p < 0.01; ***p < 0.001; ****p < 0.0001 as determined by two-way ANOVA followed by a post hoc Tukey’s test.

