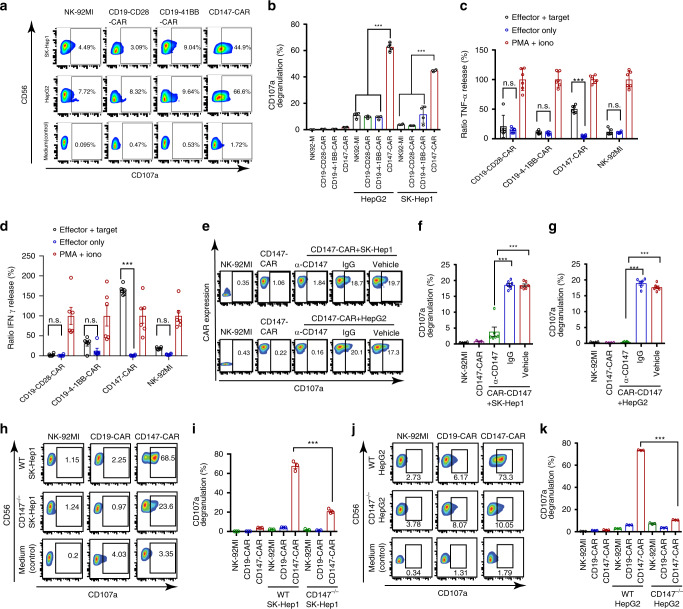
Fig. 1. Activation profiles of CD147-CAR-NK-92MI stimulated with sensitive target cells.
a Representative flow cytometric data illustrating CD107a degranulation by NK-92MI, CD19-4-1BB-CAR, CD19-CD28-CAR, and CD147-CAR after mixing with the medium (control), SK-Hep1, and HepG2. b Quantitative data for the percentage of surface CD107a expression on CD147-CAR-NK-92MI cells upon different stimulations, as indicated. Data represent the mean ± SEM (n = 4). c, d Cytokine TNF-α (c) and IFNγ (d) production by CD147-CAR-NK-92MI, CD19-4-1BB-CAR-NK-92MI, CD19-CD28-CAR-NK-92MI, and wild-type NK-92MI stimulated by different conditions. Data are pooled from four independent experiments. e Representative data showing the percentage of surface CD107a expression on CD147-CAR-NK-92MI cells upon different stimulations, as indicated. Isotype-mouse IgG (IgG) or PBS (vehicle control group) was used, as indicated. f, g Quantitative data for the percentage of surface CD107a staining on CD147-CAR-NK-92MI cells stimulated with CD147+ SK-Hep1 and CD147+ HepG2 cell lines. Wild-type NK-92MI cells alone and CD147-CAR-NK-92MI cells alone were used as controls, as indicated. Data represent the mean ± SEM of four independent experiments. h Representative data showing the percentage of surface CD107a expression on CD147-CAR-NK-92MI cells stimulated with CD147+ wild-type (WT) SK-Hep1 cell line (top panel) and CD147-knockout (CD147−/−) SK-Hep1 cell line (middle panel). i Quantitative data for the percentage of surface CD107a staining on CD147-CAR-NK-92MI cells stimulated with CD147+ SK-Hep1 (WT) and CD147-knockout SK-Hep1 (CD147−/−) cell lines, respectively. Data represent the mean ± SEM of three independent experiments. j Representative data showing the percentage of surface CD107a expression on CD147-CAR-NK-92MI cells stimulated with a CD147+ wild-type (WT) HepG2 cell line (top panel) and a CD147-knockout HepG2 cell line (middle panel). k Quantitative data for the percentage of surface CD107a staining on CD147-CAR-NK-92MI cells stimulated with CD147+ HepG2 (WT) and CD147-knockout HepG2 (CD147−/−) cell lines, respectively. Data represent the mean ± SEM of three separate experiments. Unpaired Student’s t test was employed for all the panels. ***p < 0.001; n.s. not significant.

