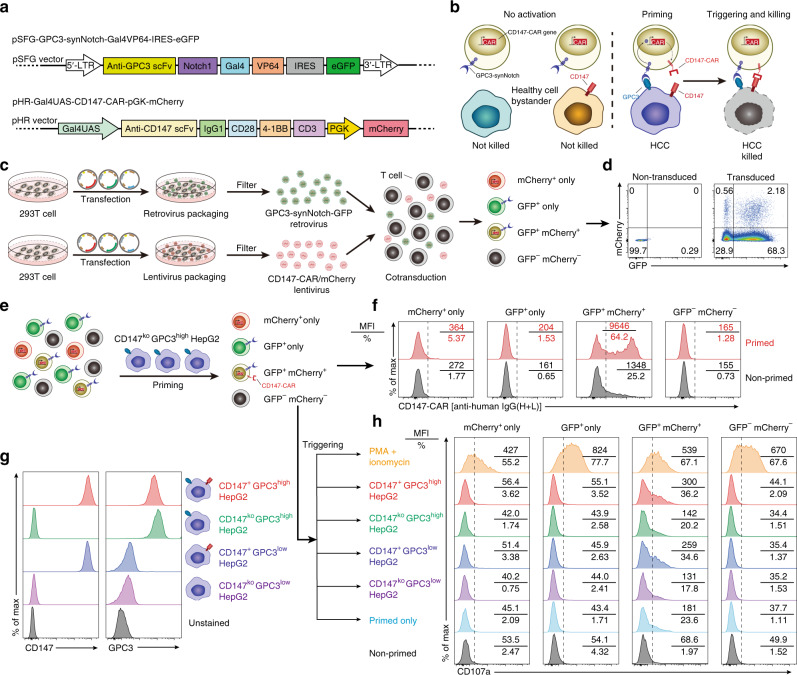
Fig. 6. GPC3-synNotch-inducible CD147-CAR-T cells selectively target GPC3+CD147+-double-positive, but not single-positive HepG2 cells.
a Schematic design of GPC3-Gal4VP64-synNotch receptor in SFG retroviral vector and CD147-CAR based on the pHR lentiviral vector. The SFG retroviral vector contains eGFP, which can be used as a marker for selecting GPC3-Gal4VP64-synNotch+ cells. The pHR lentiviral vector contains mCherry, which can be used as a marker for selecting CD147-CAR+ cells. b Schematic design of “logic-gated” GPC3-synNotch and CD147-CAR showing induced cytotoxicity when both antigens are coexpressed, but not when they are separately expressed on bystander or healthy cells. c, d Schematic experimental design of GPC3-synNotch-GFP and CD147-CAR-mCherry vectors cotransduced T cells (c) and representative flow cytometric analysis of GPC3-synNotch-GFP and CD147-CAR-mCherry expression (d). e Schematic experimental design of GPC3-synNotch-GFP and CD147-CAR-mCherry vectors cotransduced into T cells, priming by GPC3highCD147low HepG2 cell line, and followed by CD147-CAR expression analysis among different subsets of transduced T cells, including mCherry+-only, GFP+-only, GFP- and mCherry-double-positive, and GFP- and mCherry-double-negative subsets. f Representative flow cytometric analysis of CD147-CAR expression on the surface of different subsets of transduced T cells. Both mean fluorescence intensity (MFI) and percentage of CD147-CAR are displayed in each representative flow cytometric chart. g Representative flow cytometric analysis of CD147 and GPC3 expression on HepG2 tumor cell lines. h Quantitative analysis of surface CD107a expression on different subsets of transduced T cells after “primed and triggered” protocol by different HepG2 tumor cell lines for 2 h. Data are representative of two independent experiments.

