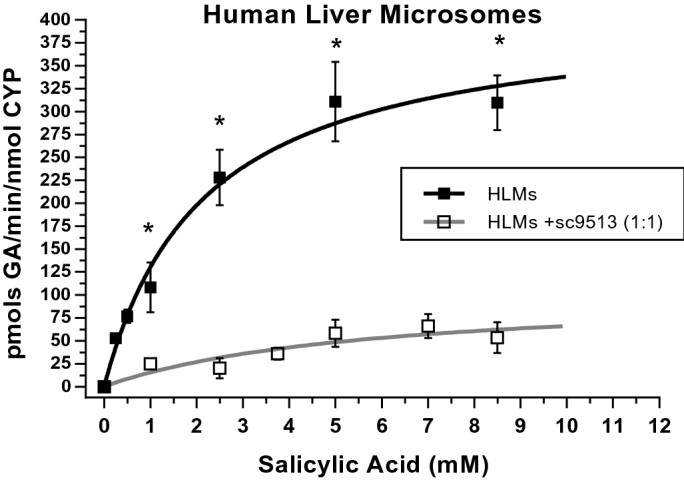
Figure 5.

Dependence of production of GA upon SA concentration in HLM. Data were obtained incubating 0.4 mg of HLMs at 37 °C (pH 7.4). The anti-cyt b5 sc9513 antibody was used at a stoichiometric molar ratio sc9513:Cyt b5 of 1:1, with a content of 383 pmols of cyt b5 per mg of HLM protein (see the text above), and preincubated for 60 min with HMLs before starting the enzymatic reaction. Solid square symbols correspond to the values of activity obtained with HLMs and open square symbols are the activity data of HLMs preincubated with sc9513. Both datasets were fit by non-linear regression to the Michaelis–Menten equation using Origin Lab 8. Student’s T-test was performed to compare the production in HLMs vs HLMs + sc9513. All p-values obtained are under 0.01 (*).
