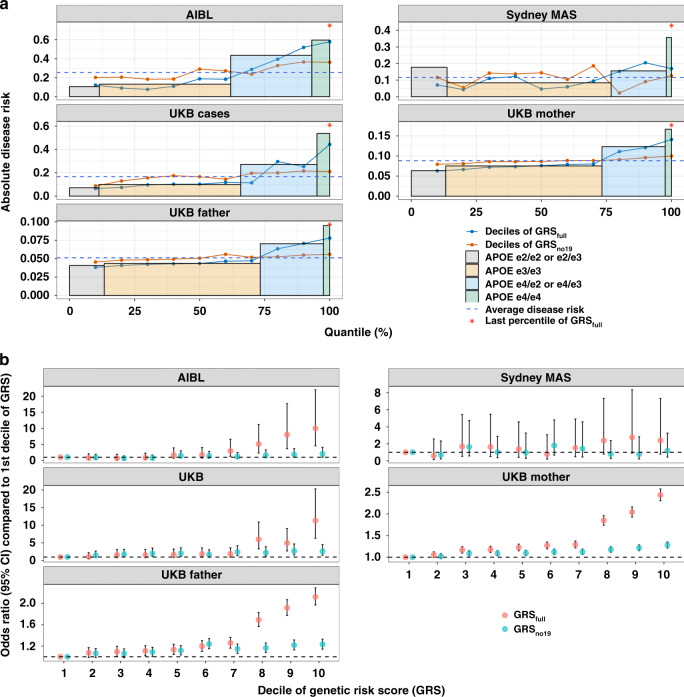
Fig. 4. The comparison of LOAD prediction performance between GRS and APOE.
a The disease risk of late-onset Alzheimer’s disease of individuals in different deciles of GRS (both GRSfull and GRSno19), last percentile of GRSfull and in individuals with APOE ɛ2/ɛ2 or ɛ2/ɛ3, APOE ɛ3 homozygotes (ɛ3/ɛ3), APOE ɛ4 heterozygotes (ɛ4/ɛ3 or ɛ4/ɛ2) and APOE ɛ4 homozygotes (ɛ4/ɛ4). Samples from AIBL, Sydney MAS, UKB cases, UKB mother and UKB father were examined. b Odds ratio between individuals in the other deciles and first decile of GRS. GRSfull was calculated based on 1,056,154 HapMap3 SNPs and two APOE SNPs. GRSno19 was calculated based on HapMap3 SNPs but excluding SNPs from chromosome 19. Only independent (R2 < 0.01) SNPs with P < 1 × 10⁻⁸ were used to calculate the GRS. The error bars in b represent 95% confidence interval.

