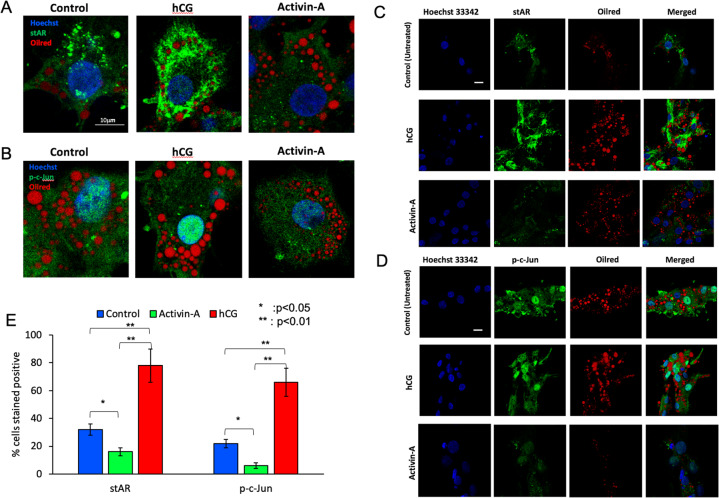
Fig. 5. Confocal images of the luteal granulosa cells.
The intensity of staining for StAR (green signal, a high magnification, c low magnification) and phospho-c-Jun (green signal, b high magnification, d low magnification) are substantially increased and decreased after treatment with hCG and activin-A respectively. In accordance with this the percentage of the cells stained positive for these markers were significantly decreased in the activin-treated cells in comparison to control and hCG-treated ones (e). Nuclei were highlighted in blue with DAPI staining. Oil Red O staining shows neutral lipid droplets in the cells as red dots. Scale bar is 10 μm.

