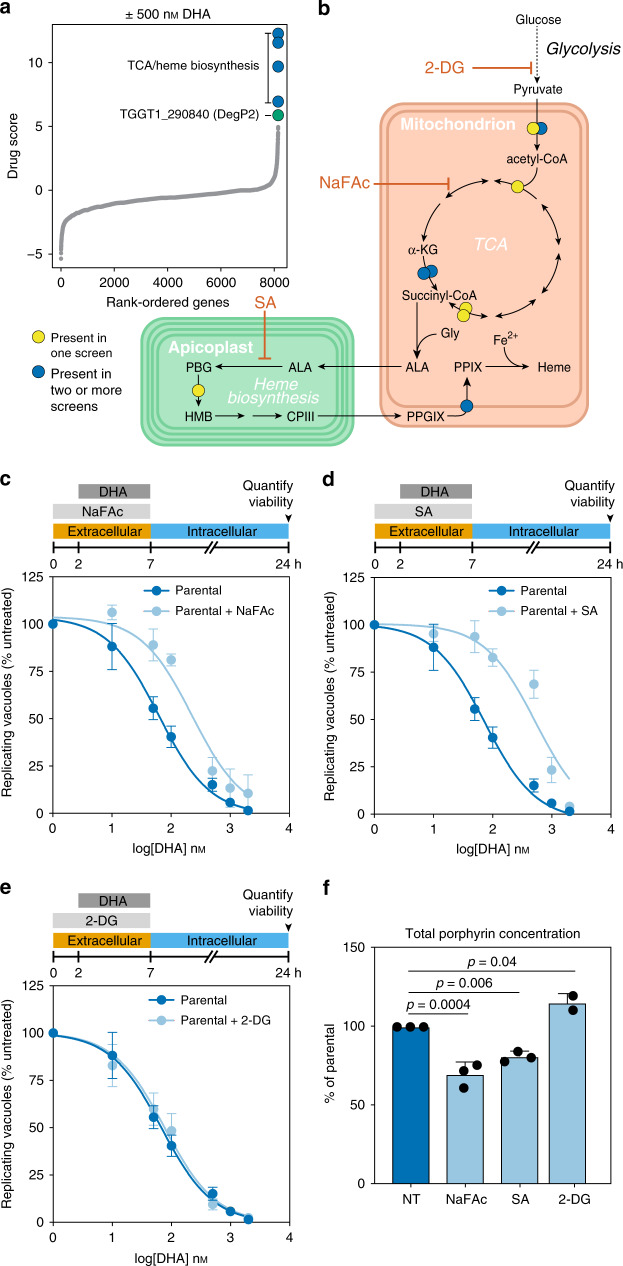
Fig. 3. Genome-wide CRISPR screen under high DHA pressure identifies TCA and heme biosynthetic pathways as determinants of DHA susceptibility.
a Aggregated drug scores from two independent genome-wide CRISPR screens performed with a lethal dose of 500 nM DHA. Drug scores defined as the log2-fold change in the relative gRNA abundance between the DHA-treated and vehicle populations, where higher scores are indicative of genes that reduce drug susceptibility when disrupted. Genes with consistently high drug scores are highlighted, indicating that their disruption favored parasite survival under otherwise lethal concentrations of DHA. b Diagram of key metabolic pathways highlighting genes with high drug scores in the screens from a and a third screen performed with 10 µM DHA, analyzed separately. Predicted localization of enzymes within organelles for the TCA cycle and heme biosynthesis pathways. 2-DG 2-deoxyglucose, ɑ-KG ɑ-ketoglutarate, ALA δ-aminolevulinic acid, CPIII coproporphyrinogen III, Gly glycine, HMB hydroxymethylbilane, NaFAc sodium fluoroacetate, PGB porphobilinogen, PPIX protoporphyrin IX, PPGIX protoporphyrinogen IX, SA succinyl acetone. Hits found in two or more replicates (blue) or only one replicate (yellow) are indicated. c Pretreatment with 500 mM NaFAc for 2 h significantly increased the EC50 of DHA (extra-sum-of-squares F-test, p < 0.0001). Results are mean ± SEM for n = 7 or 4 independent experiments with vehicle or NaFAc treatment, respectively. d Pretreatment with 10 mM SA significantly increased the EC50 of DHA (extra-sum-of-squares F-test, p < 0.0001). Results are mean ± SEM for n = 7 or 5 independent experiments with vehicle or SA treatment, respectively. e Pretreatment with 5 mM 2-DG did not significantly affect the EC50 of DHA (extra-sum-of-squares F-test, p = 0.6). Results are mean ± SEM for n = 7 or 3 independent experiments with vehicle or 2-DG treatment, respectively. f Porphyrin levels (combination of heme and PPIX) in parasites exposed to various compounds, measured by fluorescence and normalized to untreated parasites (NT). Results are mean ± SD for n = 3 independent experiments, each performed in technical duplicate; p-values from a one-way ANOVA with Tukey’s test.

