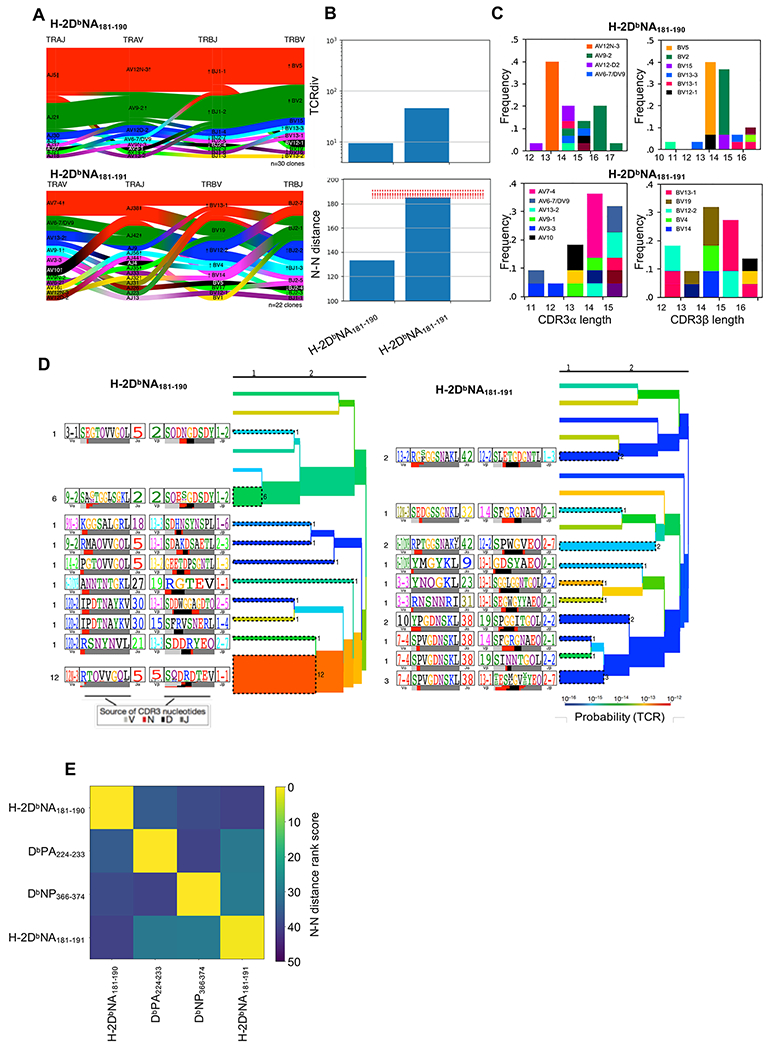
Figure 3: Characterization of CD8+ H-2DbNA181-190- and H-2DbNA181-191-specific TCR αβ repertoires after infection.

Female C57BL/6J mice were infected i.n. with 1000 PFU of PR8 influenza virus and individual H-2DbNA181-190- and H-2DbNA181-191-specific CD8+ T cells from pooled spleen and lymph nodes were single cell sorted for subsequent multiplexed analysis of paired TCR CDR3α and CDR3β sequences. All clonotypes analyzed have arisen independently of one another (i.e. data is independent of clonal abundance). H-2DbNA181-190- and H-2DbNA181-191-specific CD8+ T cell repertoires were characterized from the same mice (N=3 mice). (A) Gene pairing structure of H-2DbNA181-190- and H-2DbNA181-191-specific TCRαβ clonotypes. Enrichments or depletions of gene segments relative to background are shown for all labeled genes by up or down arrows where the number of arrowheads reflects the base-2 logarithm of the fold change. (B) Upper panel is a modified version of the Simpson’s Diversity Index, incorporating receptor similarity as well as identity; lower panel is the nearest neighbor distance between each TCRαβ within the repertoire and its nearest 10% of neighbors, averaged across the entire repertoire. Dashed red lines are an estimate of distances obtained from background non-antigen specific TCR repertoires composed of randomly selected TCRαβ chains from bulk sequences (26). (C) Shown are the CDR3α (left panels) and CDR3β length distributions (right panels) for each epitope-specific population, coloured according to gene segment usage. Segment must represent ≥5% of dataset in order to be depicted. (D) TCRdist clustering trees depicting the distance between TCRs within the epitope-specific TCRαβ repertoires. The thickness of the branches is proportional to the number of unique TCRαβ clones represented by those branches. The TCR logo containing the CDR3 sequence is shown on the left with residue height scaled by frequency. The colored bars underneath represent the source of the nucleotides that encode the logo, as depicted in key. The branches are colored according to TCR generation probability as depicted in key, with red being the easiest TCRs to generate via recombination (26). (E) Heat map showing a distance measure between different epitope-specific repertoires, based on the nearest neighbor distance measures within each repertoire. Yellow repertoires are similar to one another, while blue repertoires are distinct. TCR repertoires from 3 mice were analyzed, with n=23, 19, and 29 sequences for H-2DbNA181-190, and n=31, 25, 13 sequences for H-2DbNA181-191.
