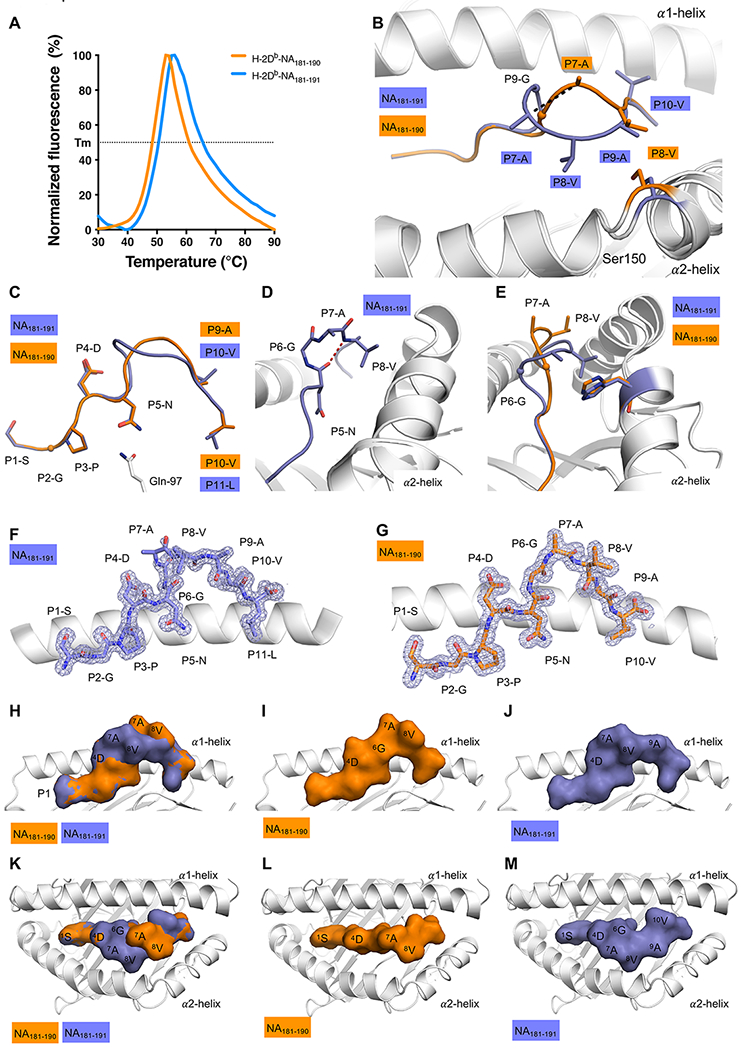
Figure 5: Structure of H-2DbNA181-190 and H-2DbNA181-191 epitopes bound to H-2Db MHC-I.

(A) Thermal shift assay data. Normalized Fluorescence (in %) is shown on Y axis, and temperature in °C is shown on the X axis. The data for H-2DbNA181-190 is shown in orange, the data for H-2DbNA181-191 is shown in blue. The calculated thermal melt point (Tm) represents the temperature required to unfold 50% of the protein. All panels (B-M) show H-2Db in white, NA181-190 and NA181-191 peptides in orange and blue, respectively. (B) Superposition of the H-2Db structures presenting the NA181-190 and NA181-191 peptides: the Ser150 of the α2-helix is colored accordingly to the peptide presented by H-2Db. Ser150 is represented as stick and the peptides are in stick and cartoon representation. The maximum displacement observed for the Cα atom of the P7-A represented by black dashed line. (C) Overlay of the peptides represented as stick and cartoon, with only the Gln97 (white stick) of the H-2Db molecule shown. (D) Closer view on the NA181-191 peptide, colored in blue, highlighting the secondary structure 310 helix formed in the central region of the peptide, with the hydrogen bond between P5-N (i) and P8-V (i+3) represented by a red dashed line. (E) Side view of the cleft to show the exposed P7-A and P8-V residues of the NA181-190 peptide (orange), that are partially buried and NA181-191 peptide structure (blue), in contact with His155 (stick colored accordingly to the peptide presented by H-2Db). (F and G) The 2Fo-Fc electron density map contoured at 1 σ (grey mesh) around the (F) NA181-191 peptide, and (G) NA181-190 peptide, presented by the H-2Db molecule (white cartoon). (H to M) Surface presentation of the NA181-190 (I and L) and NA181-191 (J and M) peptide in H-2Db cleft. Overlay of NA181-190 and NA181-191 peptide (H and K). Side view (H, I ,J) and top view (K,L,M). The peptide is shown as surface representation and colored accordingly, the H-2Db cleft is shown in white cartoon.
