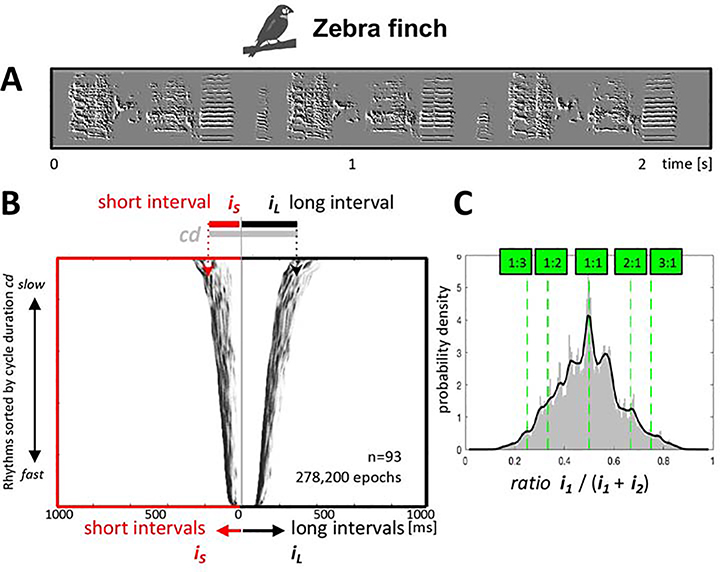
Figure 2. Zebra finch rhythms.
A: a sonogram with spectral derivatives of a zebra finch song showing three repetitions of the bird’s motif. B: Two-interval raster plots of pooled rhythms of 93 zebra finches (as in Figure 1B). C: Histogram with probability density of rhythm ratios pooled across 93 zebra finches.

