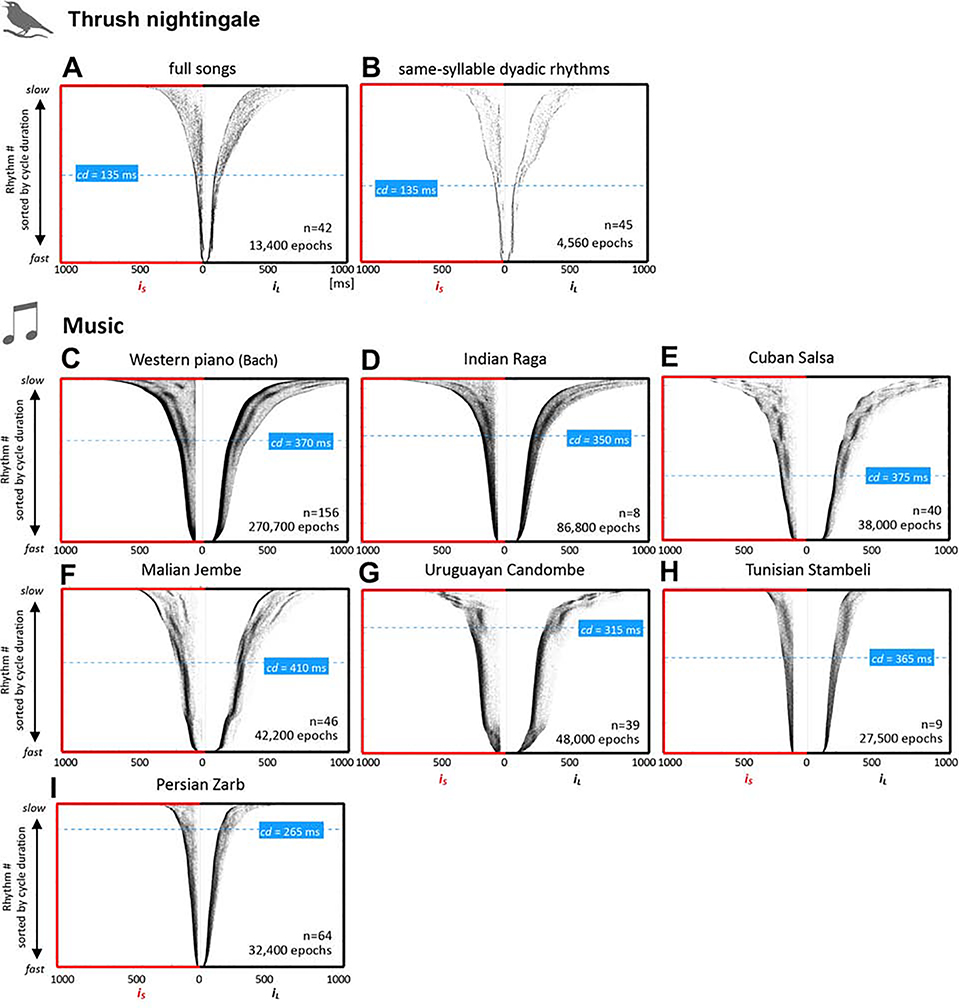
Figure 3: Thrush nightingale song vs. music rhythm structure.
A, B: same sorted raster plots of dyadic rhythm epochs as in Figure 1B & H, for easier interspecies comparison, C-I, sorted raster plots for seven musical corpora from different musical cultures. For multi-instrument music (D-H), rhythms were extracted from each instrument and then pooled together (for surface rhythm across instruments see Figure S1). Dashed blue lines indicate the transition point between stem and petals, blue boxes tempo at transition (as cycle duration [cd]).

