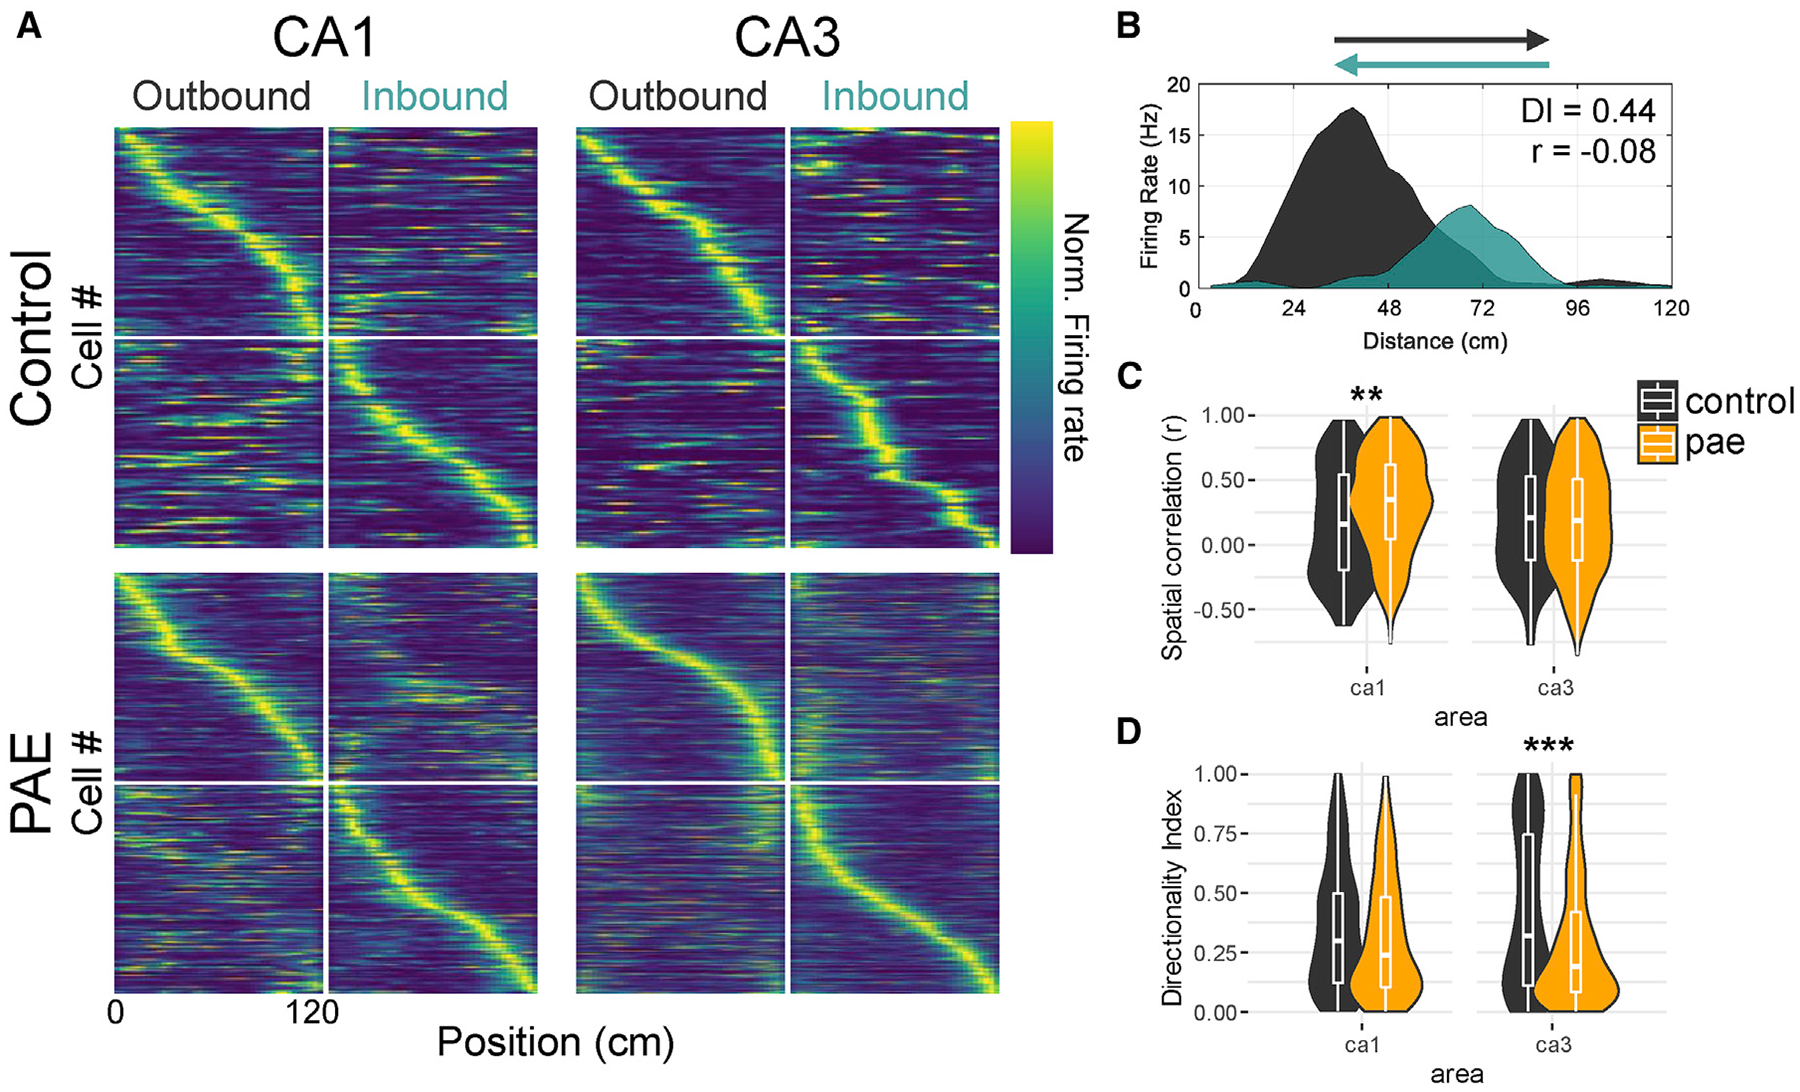
Figure 3. Reduced CA1 and CA3 Place Cell Directionality after PAE.

(A) Population vectors of place cells sorted by their location of peak firing rate. Each row (y axis) indicates the firing rate of a single cell as a function of position (x axis). The color indicates firing rate normalized by the peak rate across both running directions for each cell (color bar far right). Note that place cells exhibit increased firing in either outbound or inbound running directions as indicated by the bright diagonal bands. CA1 place cells in PAE rats show a subtle appearance of warmer colors along the diagonal in the opposite running direction.
(B) Example control ca1 place cell on the linear track exemplifying bidirectional coding by both the difference in firing rate (directionality index = 0.44) and in firing position (spatial correlation = −0.08) between the two running directions.
(C) Spatial correlations between rate maps created from the two running directions. Note that PAE CA1 cells are more spatially correlated between the running directions (median CA1 r: control 0.16; PAE 0.35).
(D) Directionality index, a metric of firing rate difference, between the running directions. Note that PAE CA3 cells have decreased directionality index values, indicating that PAE CA3 cells have similar firing rates between the two running directions (median CA3 directionality: control 0.32; PAE 0.19). *p < 0.05; **p < 0.01; ***p < 0.001.
