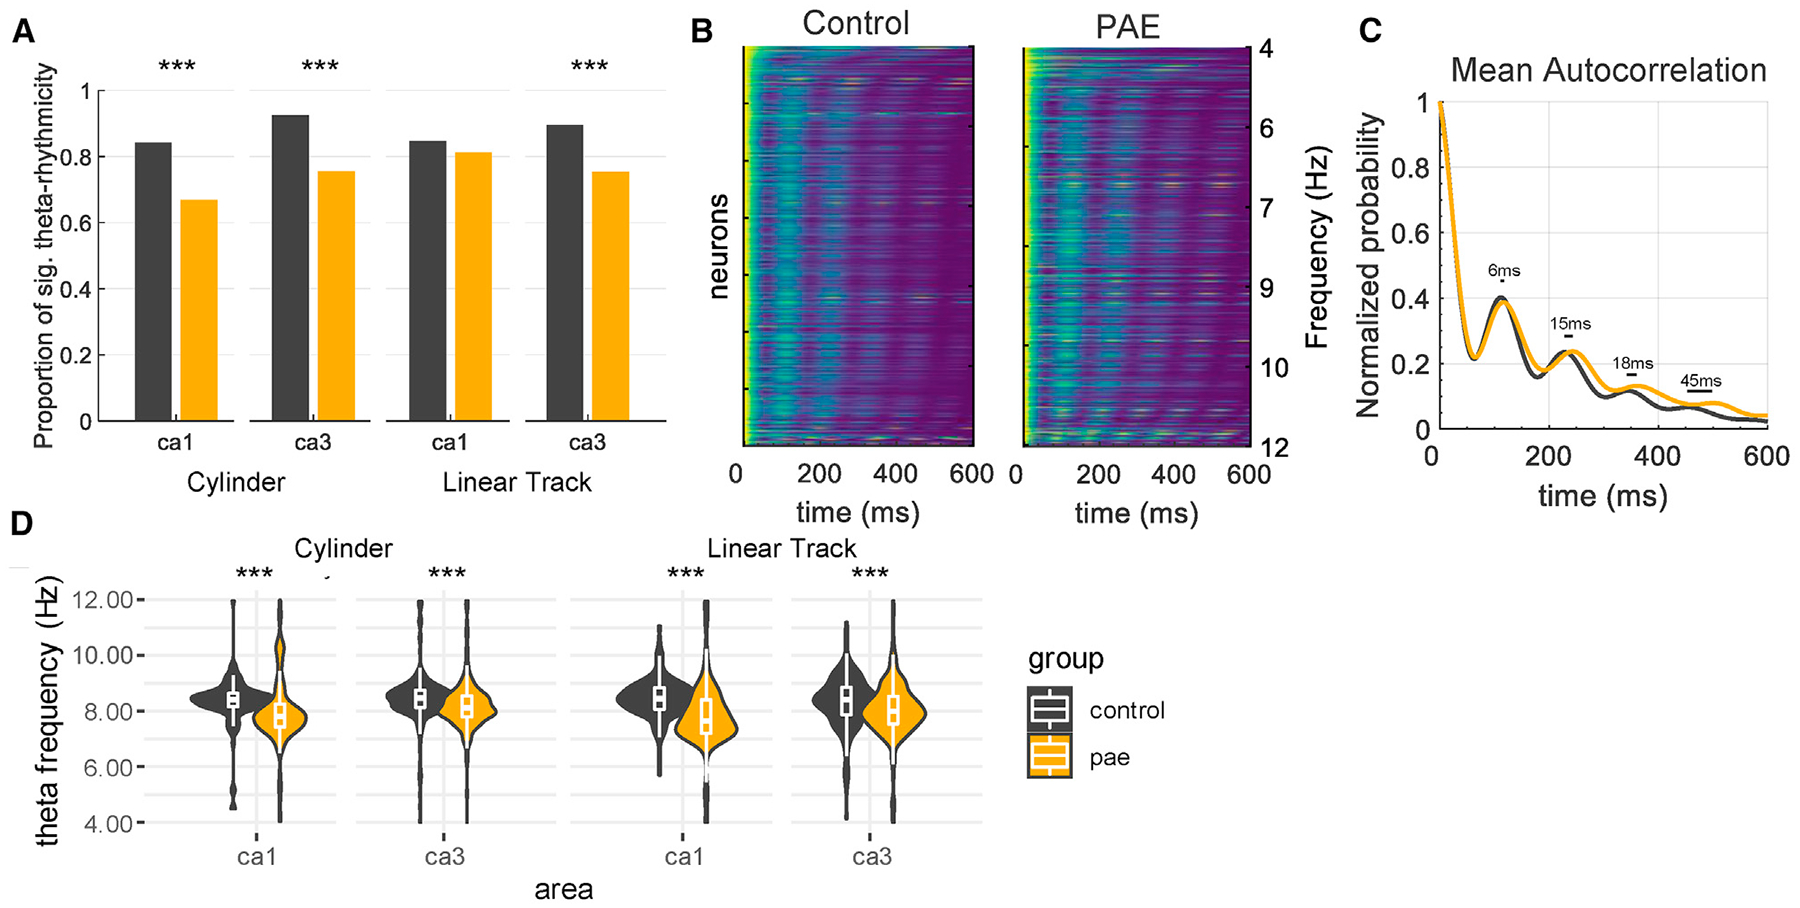
Figure 5. Theta Frequency Is Decreased following PAE.

(A) CA1 and CA3 place cells from PAE rats have decreased proportions of significant theta rhythmicity.
(B) Normalized maximum likelihood estimate (MLE) spike-time autocorrelations for control and PAE place cells from CA1 and CA3 and both environments, ordered according to their theta frequency. Warm and cool colors were assigned to the highest and lowest values, respectively, of each autocorrelation.
(C) Mean MLE spike-time correlation fits for all place cells. Note that neurons from the PAE group are approximately 6 ms slower on average for each theta cycle. All theta rhythmic units are shown in Figure S3.
(D) PAE rats have significantly slower spike-time theta frequency across CA1 and CA3 in both linear track and cylinder environments. Median differences: cylinder CA1: 0.61 Hz; cylinder CA3: 0.35 Hz; track CA1: 0.79 Hz; track CA3: 0.42 Hz. *p < 0.05; **p < 0.01; ***p < 0.001.
