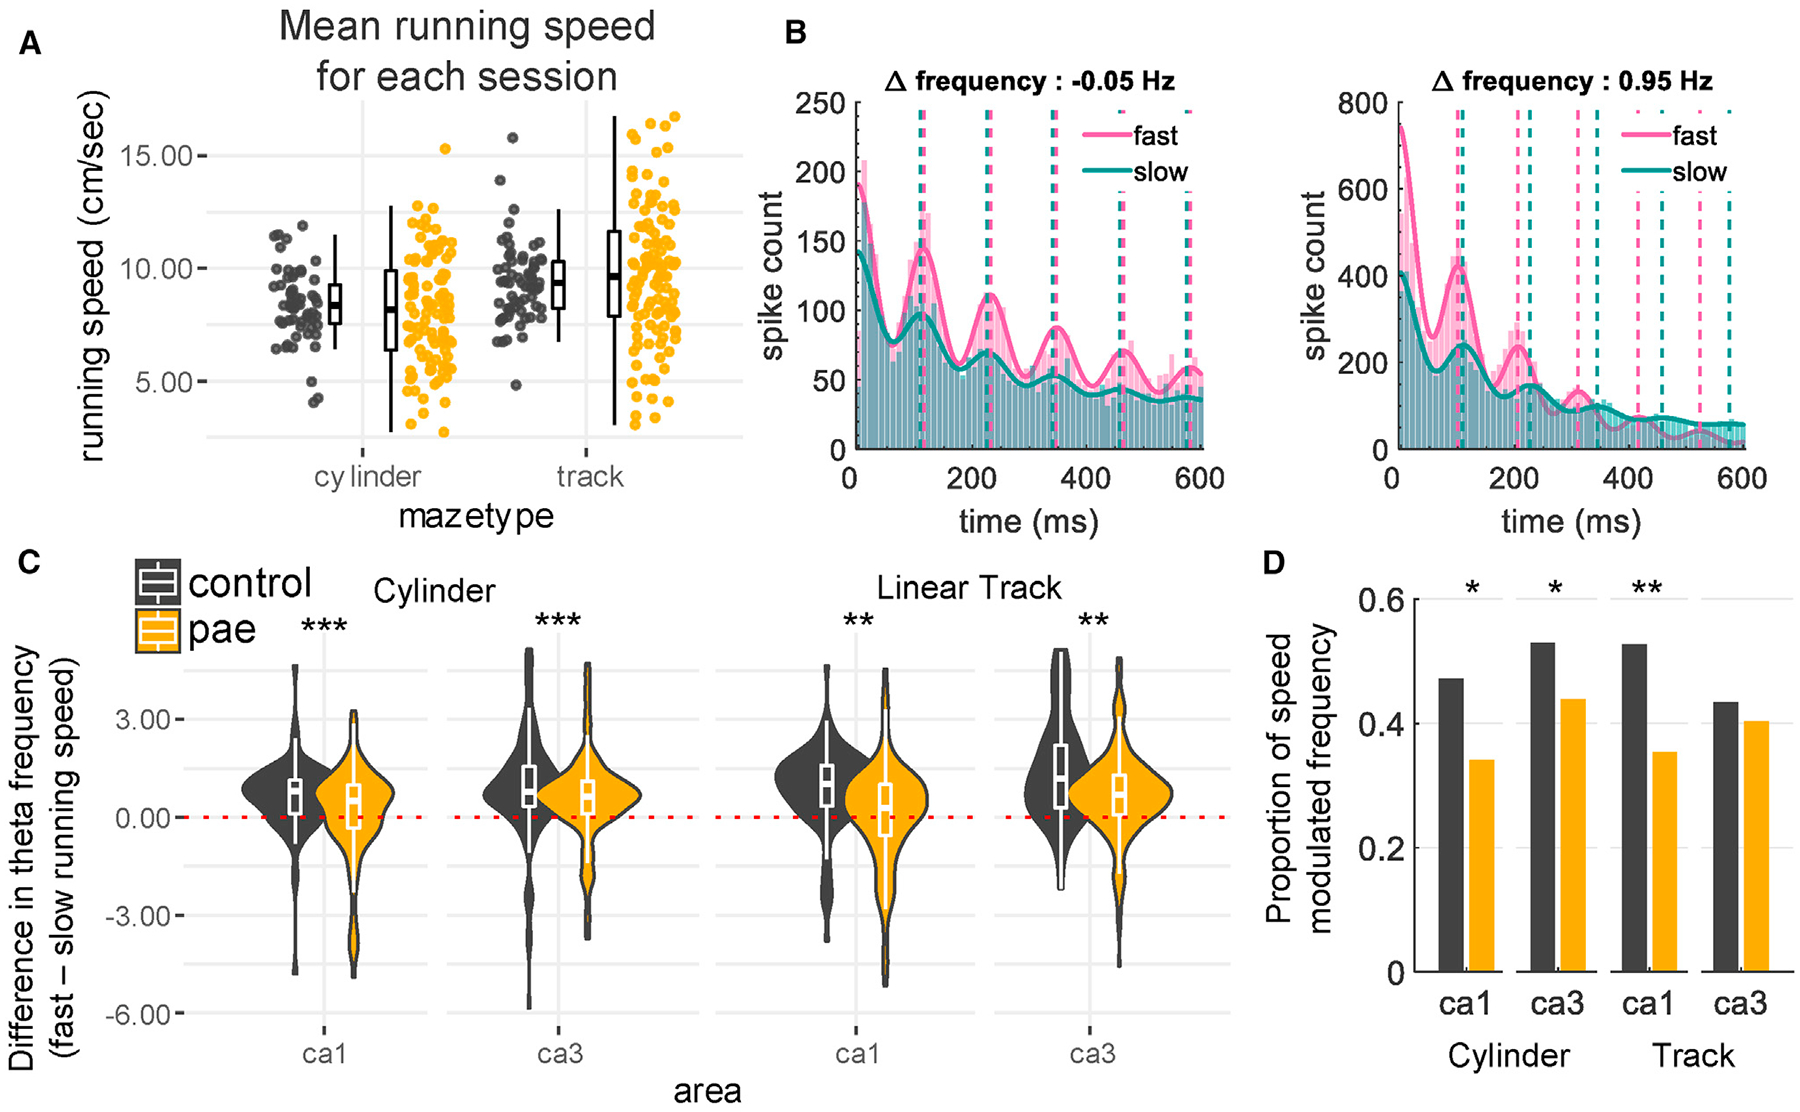
Figure 6. Running-Speed-Dependent Theta Frequency.

(A) Mean running speed (cm/s) for each session is similar between control and PAE rats (median speeds: control cylinder = 8.35 cm/s; PAE cylinder = 8.17 cm/s; control track = 9.36 cm/s; PAE track = 9.65 cm/s).
(B) Example cells demonstrating speed-modulated theta rhythmicity. Left: autocorrelogram of spike times using all spikes in the 50% fastest (mean speed 19 cm/s) and 50% slowest (mean speed 4 cm/s) running epochs. Note that this cell lacks intrinsic theta frequency speed modulation, which is evident in the overlapping peaks between the running speeds. This example neuron was from a PAE rat recorded from CA3 while the rat foraged in the cylinder. Right: autocorrelogram of spike times using all spikes in the 50% fastest (mean speed 26 cm/s) and 50% slowest (mean speed 9 cm/s) running epochs is shown. Note that this cell does display intrinsic theta frequency speed modulation, as the fast runs have an increased intrinsic frequency compared to the slow runs. This example neuron was from a control rat recorded from CA3 while the rat foraged in the cylinder. Dotted lines indicate the local maxima for each autocorrelogram, and the frequency differences are displayed above each plot.
(C) Control cells have a larger increase in theta frequency from slow to fast runs compared to PAE cells (medians group differences: CA1 cylinder 0.29; CA3 cylinder 0.14; CA1 track 0.73; CA3 track 0.50).
(D) Running speed is a significant covariate for theta frequency in a greater proportion of CA1 and CA3 control cells in the cylinder and CA1 control cells in the track compared to PAE cells (cylinder CA1 control: 47%, PAE: 34%; cylinder CA3 control: 53%, PAE: 44%; track CA1 control: 53%, PAE: 35%; track CA3 control: 43%, PAE: 40%). *p < 0.05; **p < 0.01; ***p < 0.001. The relationship between the difference in running speed and theta frequency is shown in Figure S4. Also see Figure S5.
