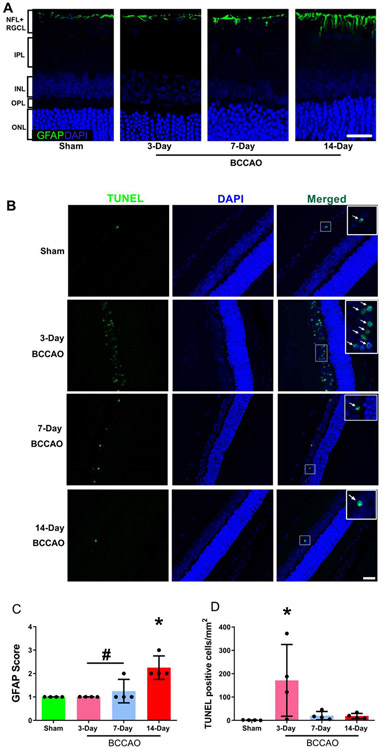
Figure 6. Gliosis and DNA damage following long-term BCCAO.
(A) Representative glial fibrillary acidic protein (GFAP) in sham, 3-day, 7-day, and 14-day BCCAO groups. GFAP is presented as the green color and cell nuclei are presented as blue color. (B) Fragmented DNA in the nuclei was evaluated by TUNEL staining in the retinal tissue. TUNEL-positive cells were presented as the green color, while cell nuclei were presented as blue color. The white arrows indicate co-expression in the same cell. (C) Semi-quantitative analysis of GFAP was performed on the highest most severe region of the retina. (D) Semi-quantitative analysis of TUNEL-positive cells was performed across the whole retina of each animal. Sham (N=4), 3-day (N=4), 7-day (N=4), and 14-day (N=4) BCCAO groups. The data are presented as mean ± SD. *p<0.05 vs Sham. #p<0.05 vs 14-day. Scale bar= 20 μm.

